21 Free charts and graphs Midjourney AI images
Welcome to our Charts and Graphs image collection, featuring 21 free AI-generated images. Explore a diverse array of stock photos, 3D objects, vectors, and illustrations showcasing various data visualization techniques. Enjoy high-resolution downloads and use our 'open in editor' feature to customize prompts for your perfect chart or graph image.


Related Tags
Charts and graphs are visual representations of data that help convey complex information in a clear, concise manner. They originated from the need to present statistical and scientific data more effectively. Today, these tools are essential in various fields, including business, education, science, and media. Charts and graphs come in many forms, such as bar charts, line graphs, pie charts, and scatter plots, each serving specific purposes in data visualization. Their primary function is to reveal patterns, trends, and relationships within data sets that might not be immediately apparent in raw numerical form.
Understanding Charts and Graphs: Essential Tools for Data Visualization
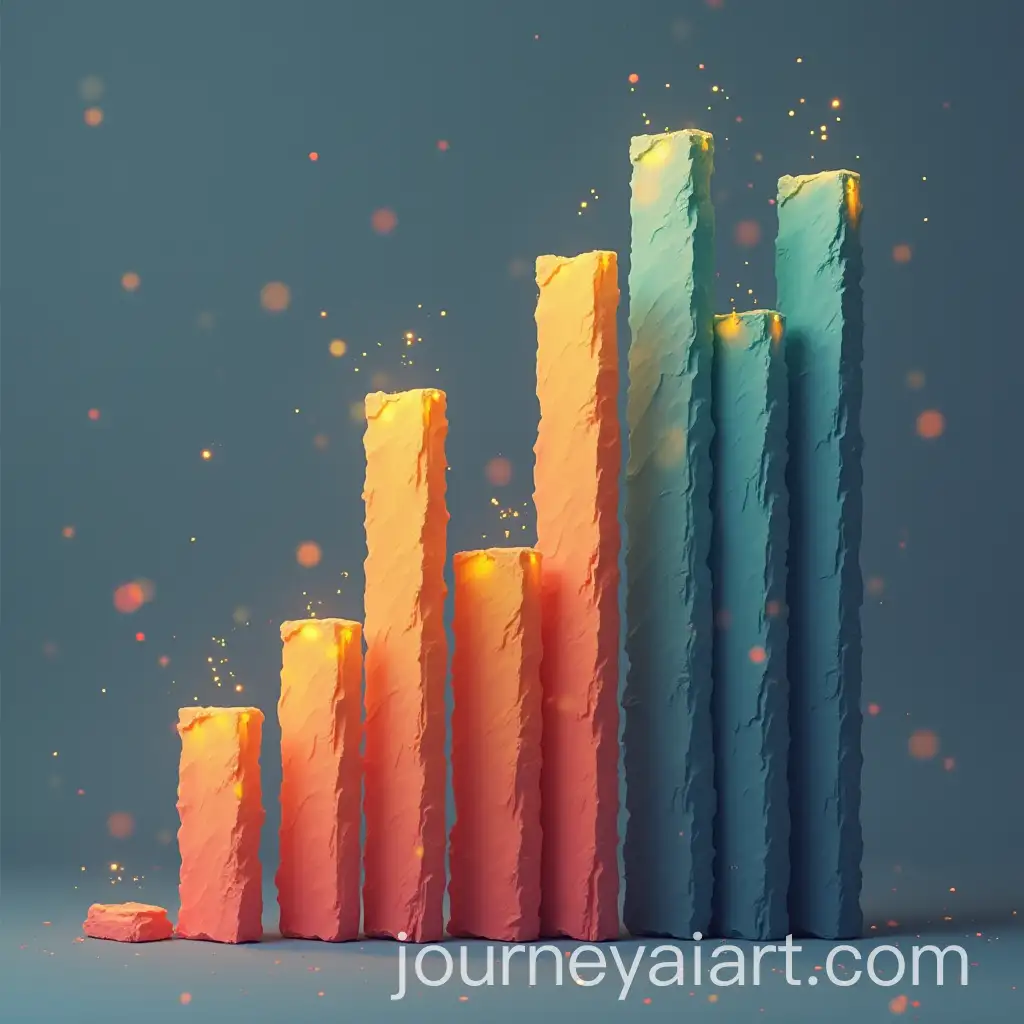
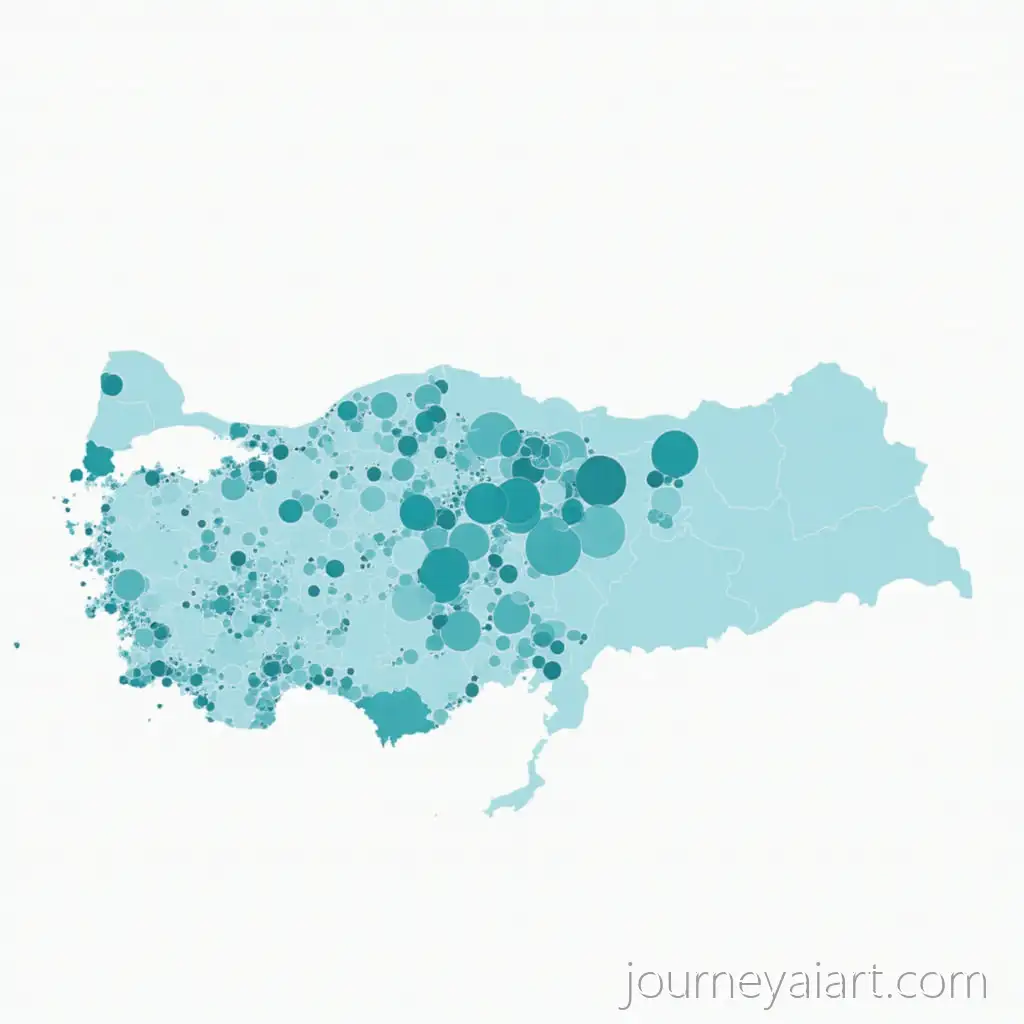
Different types of charts and graphs serve various purposes in data visualization. Bar charts are excellent for comparing quantities across categories, while line graphs effectively show trends over time. Pie charts display parts of a whole, and scatter plots reveal relationships between variables. More advanced types include heat maps, treemaps, and network diagrams. Choosing the right type depends on the nature of your data and the story you want to tell. For instance, a line graph might be ideal for showing stock price fluctuations over time, while a bar chart could better represent sales figures across different product categories.
Types of Charts and Graphs: Choosing the Right Visualization for Your Data
Charts and graphs have a profound impact on decision-making processes and effective communication in various sectors. In business, they help executives quickly grasp market trends and make informed strategic decisions. In scientific research, they aid in presenting complex findings to both peers and the general public. Media outlets frequently use charts and graphs to explain current events, economic trends, and social phenomena. The power of these visual tools lies in their ability to simplify complex data, making information more accessible and memorable. This has led to the rise of data journalism and infographics, where charts and graphs play a central role in storytelling and public education.
The Impact of Charts and Graphs on Decision Making and Communication
The future of charts and graphs is evolving with technological advancements. Interactive visualizations are becoming more prevalent, allowing users to explore data dynamically. These interactive charts can reveal additional layers of information, adjust to different data sets, or respond to user inputs in real-time. Artificial Intelligence is also playing a growing role in data visualization. AI algorithms can analyze vast amounts of data and suggest the most effective chart types for representation. Additionally, AI-driven natural language processing is enabling the creation of charts and graphs from verbal or written descriptions. As data becomes increasingly complex and abundant, we can expect to see more sophisticated, intuitive, and personalized chart and graph designs that cater to diverse user needs and preferences.
Future Trends in Chart and Graph Design: Interactive and AI-Driven Visualizations