44 Free Scientific Visualization Midjourney AI images
Welcome to our Scientific Visualization image collection, featuring 44 free AI-generated images. Explore a diverse array of stock photos, 3D objects, vectors, and illustrations. Enjoy high-resolution downloads and use our 'open in editor' feature to customize prompts for your perfect image.


Related Tags
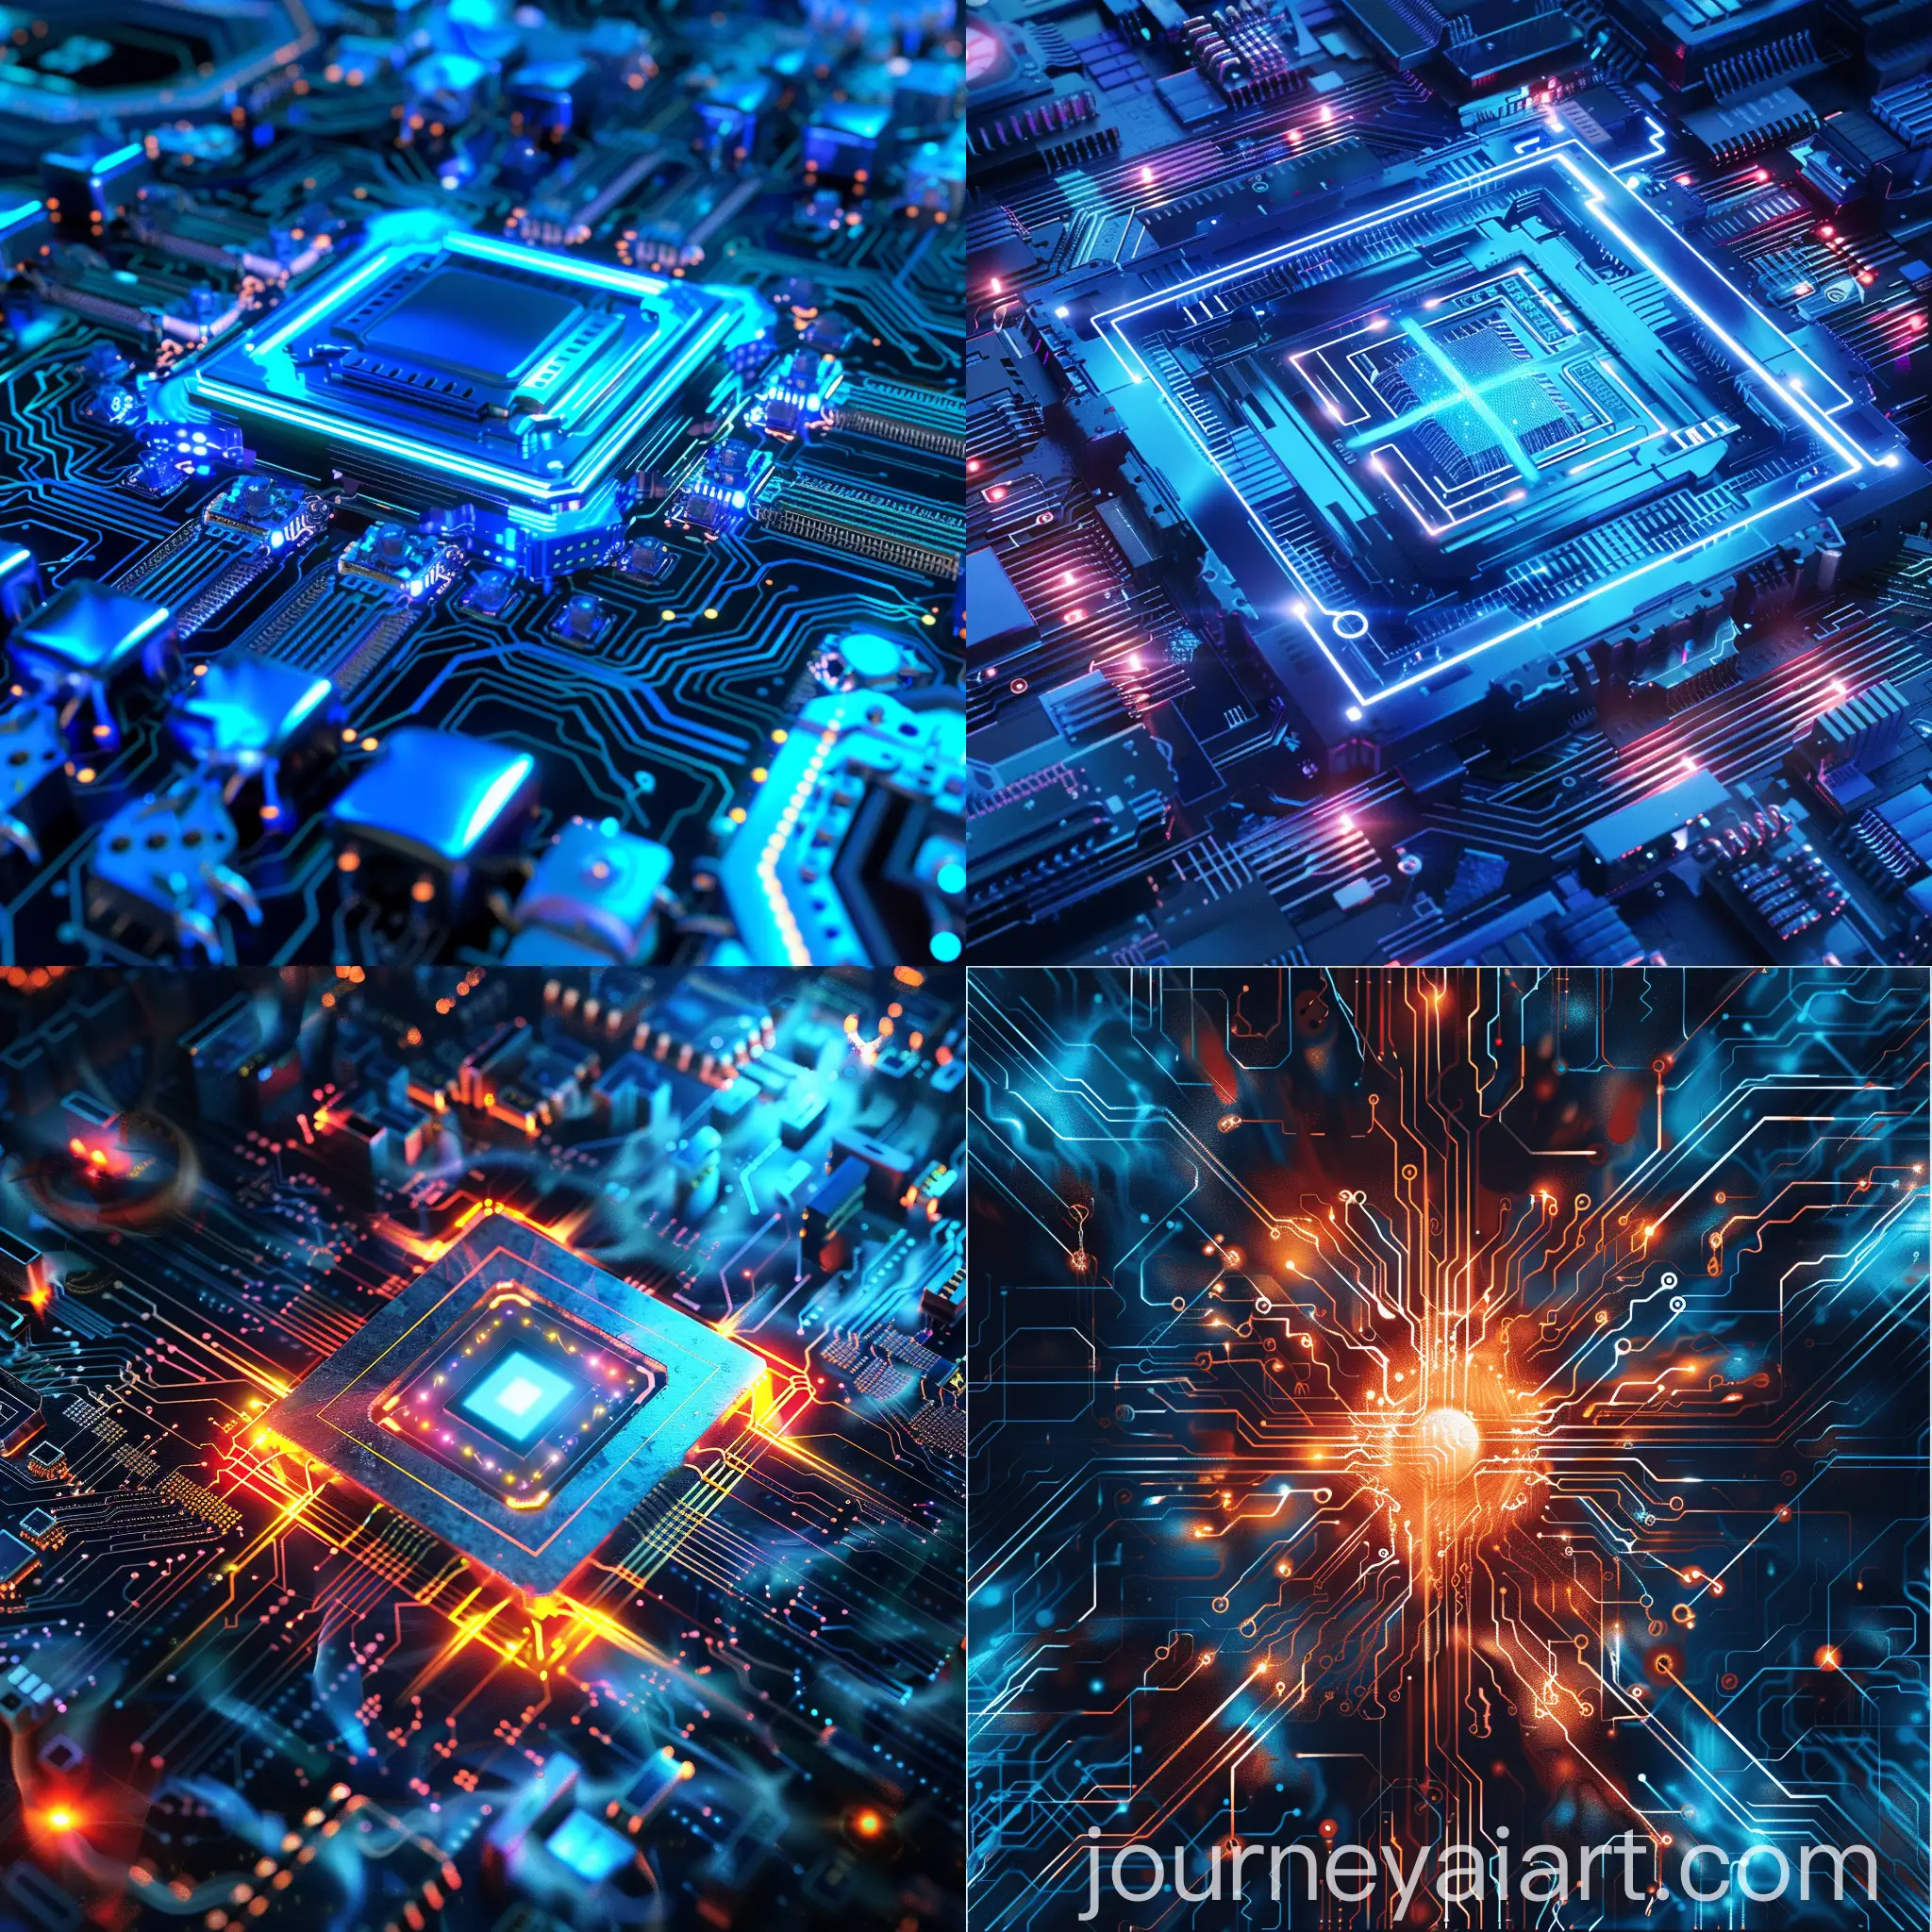
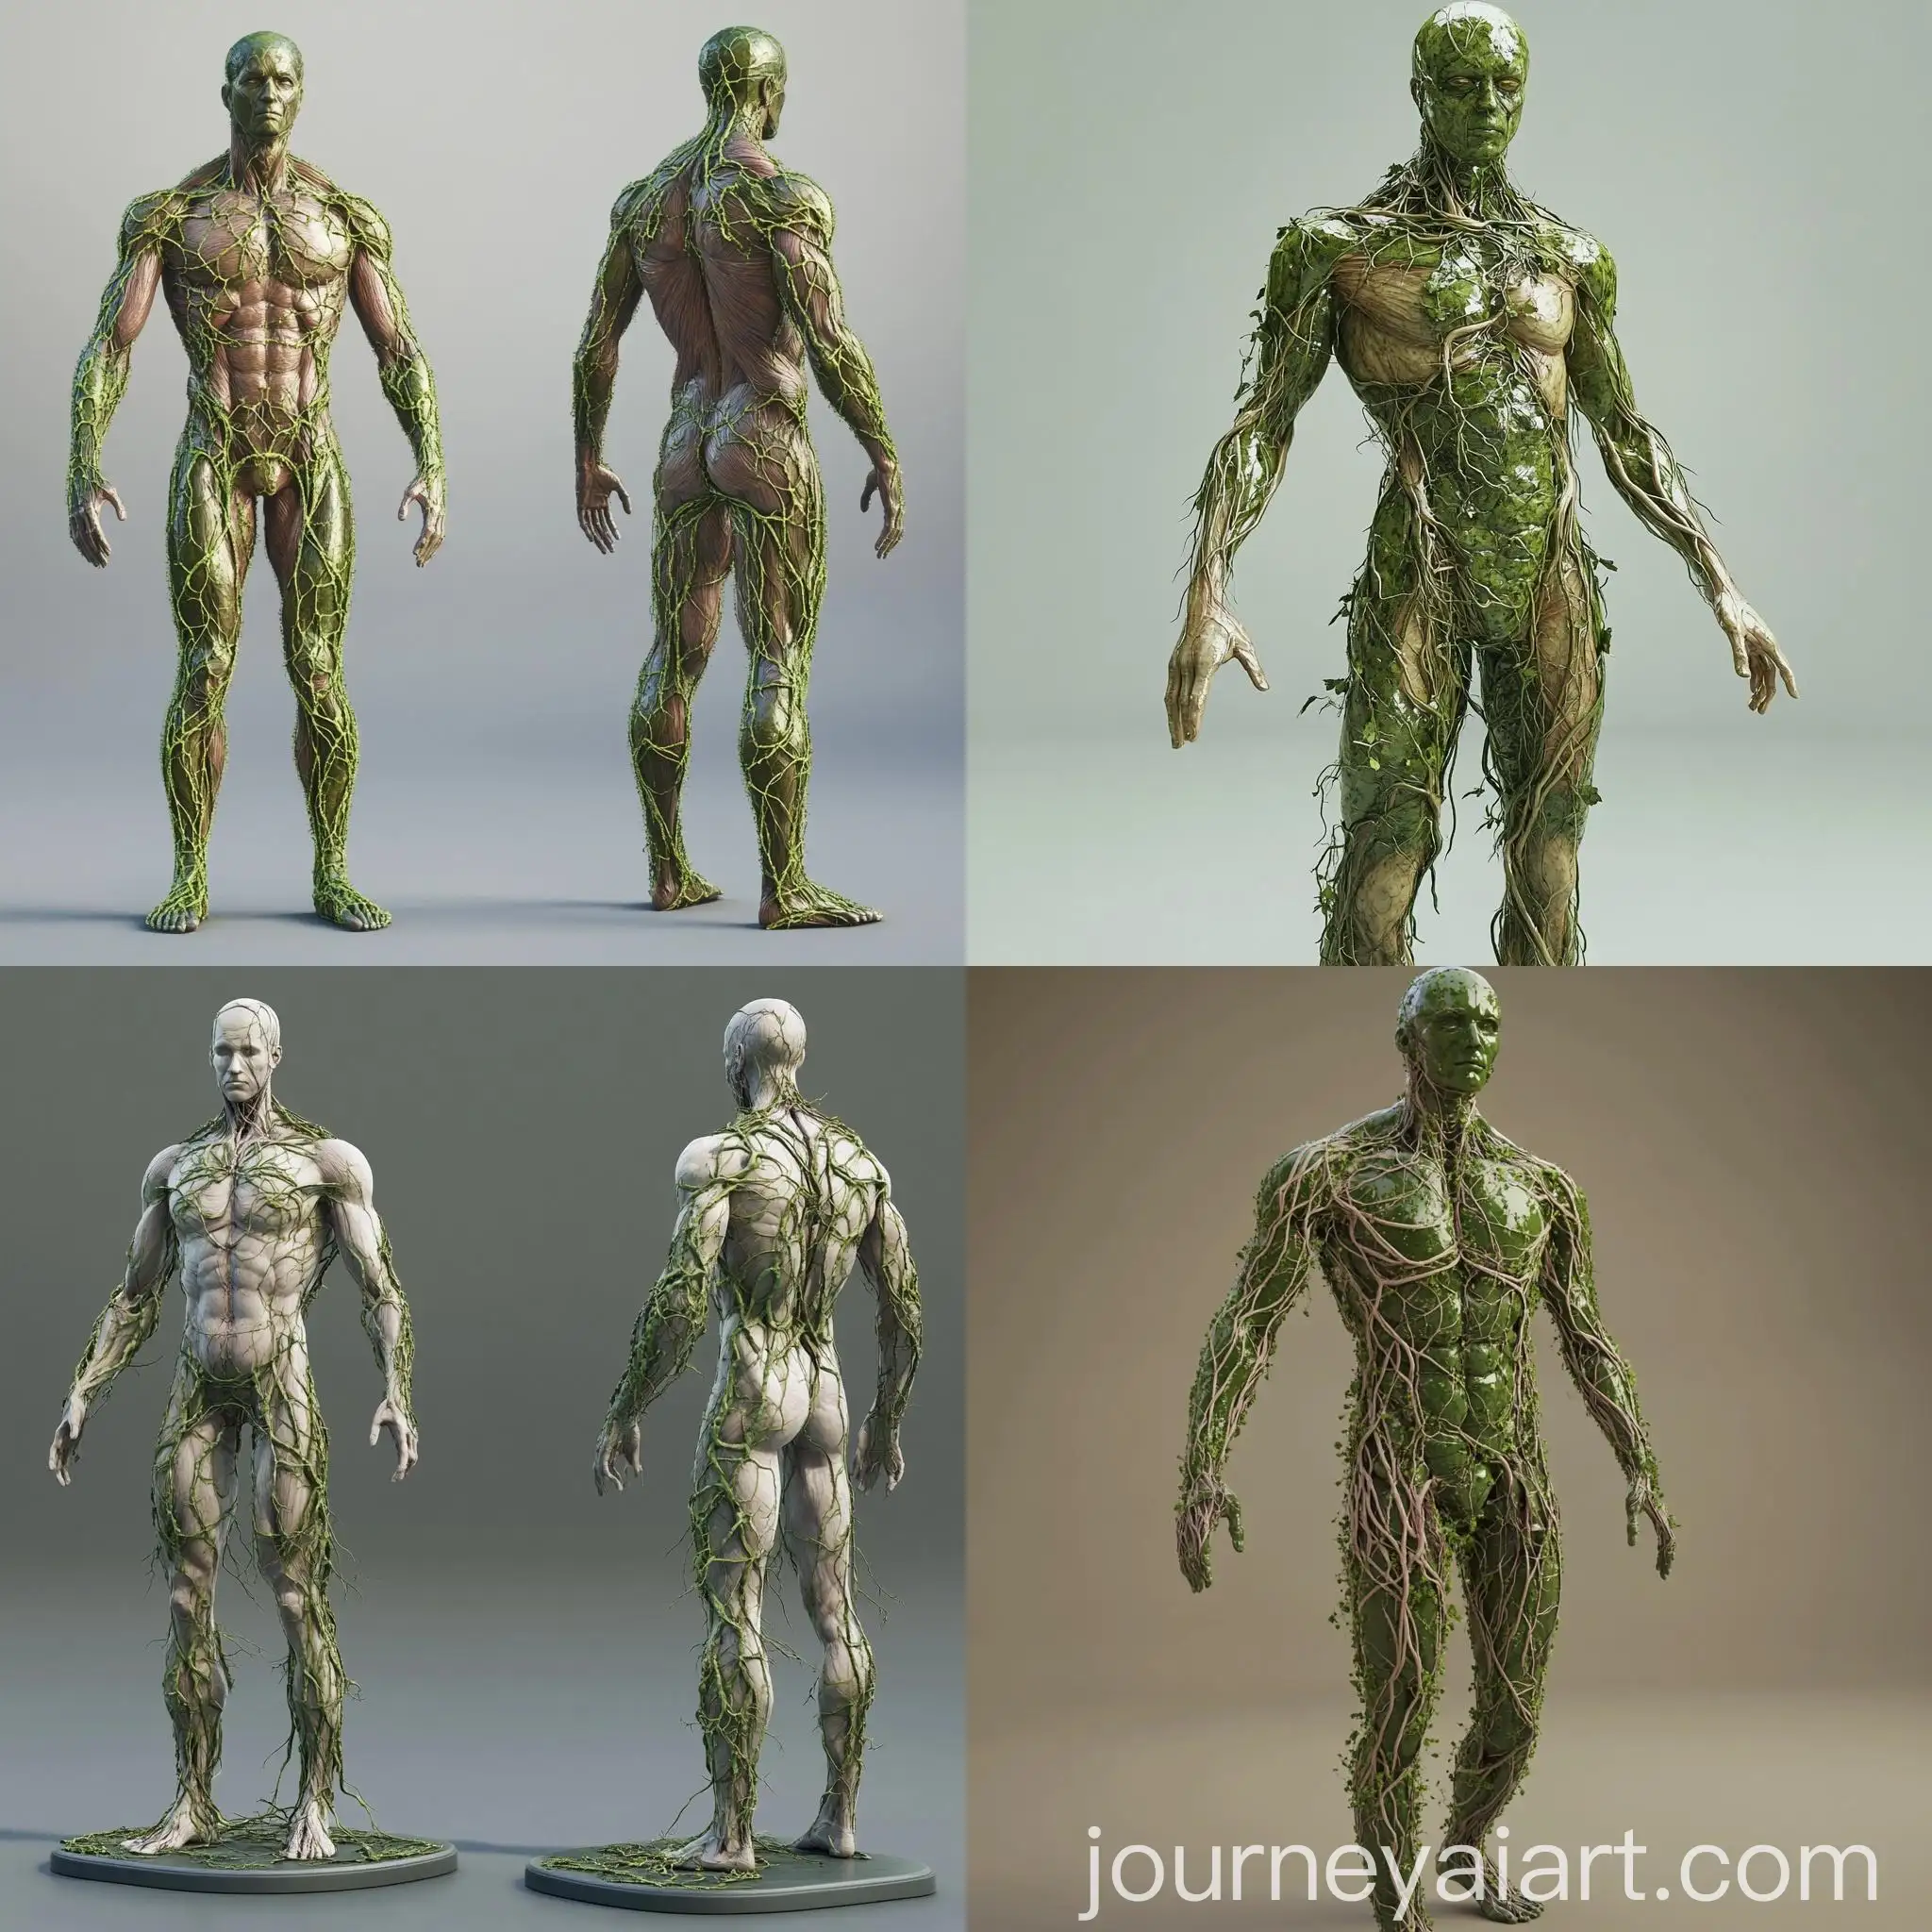
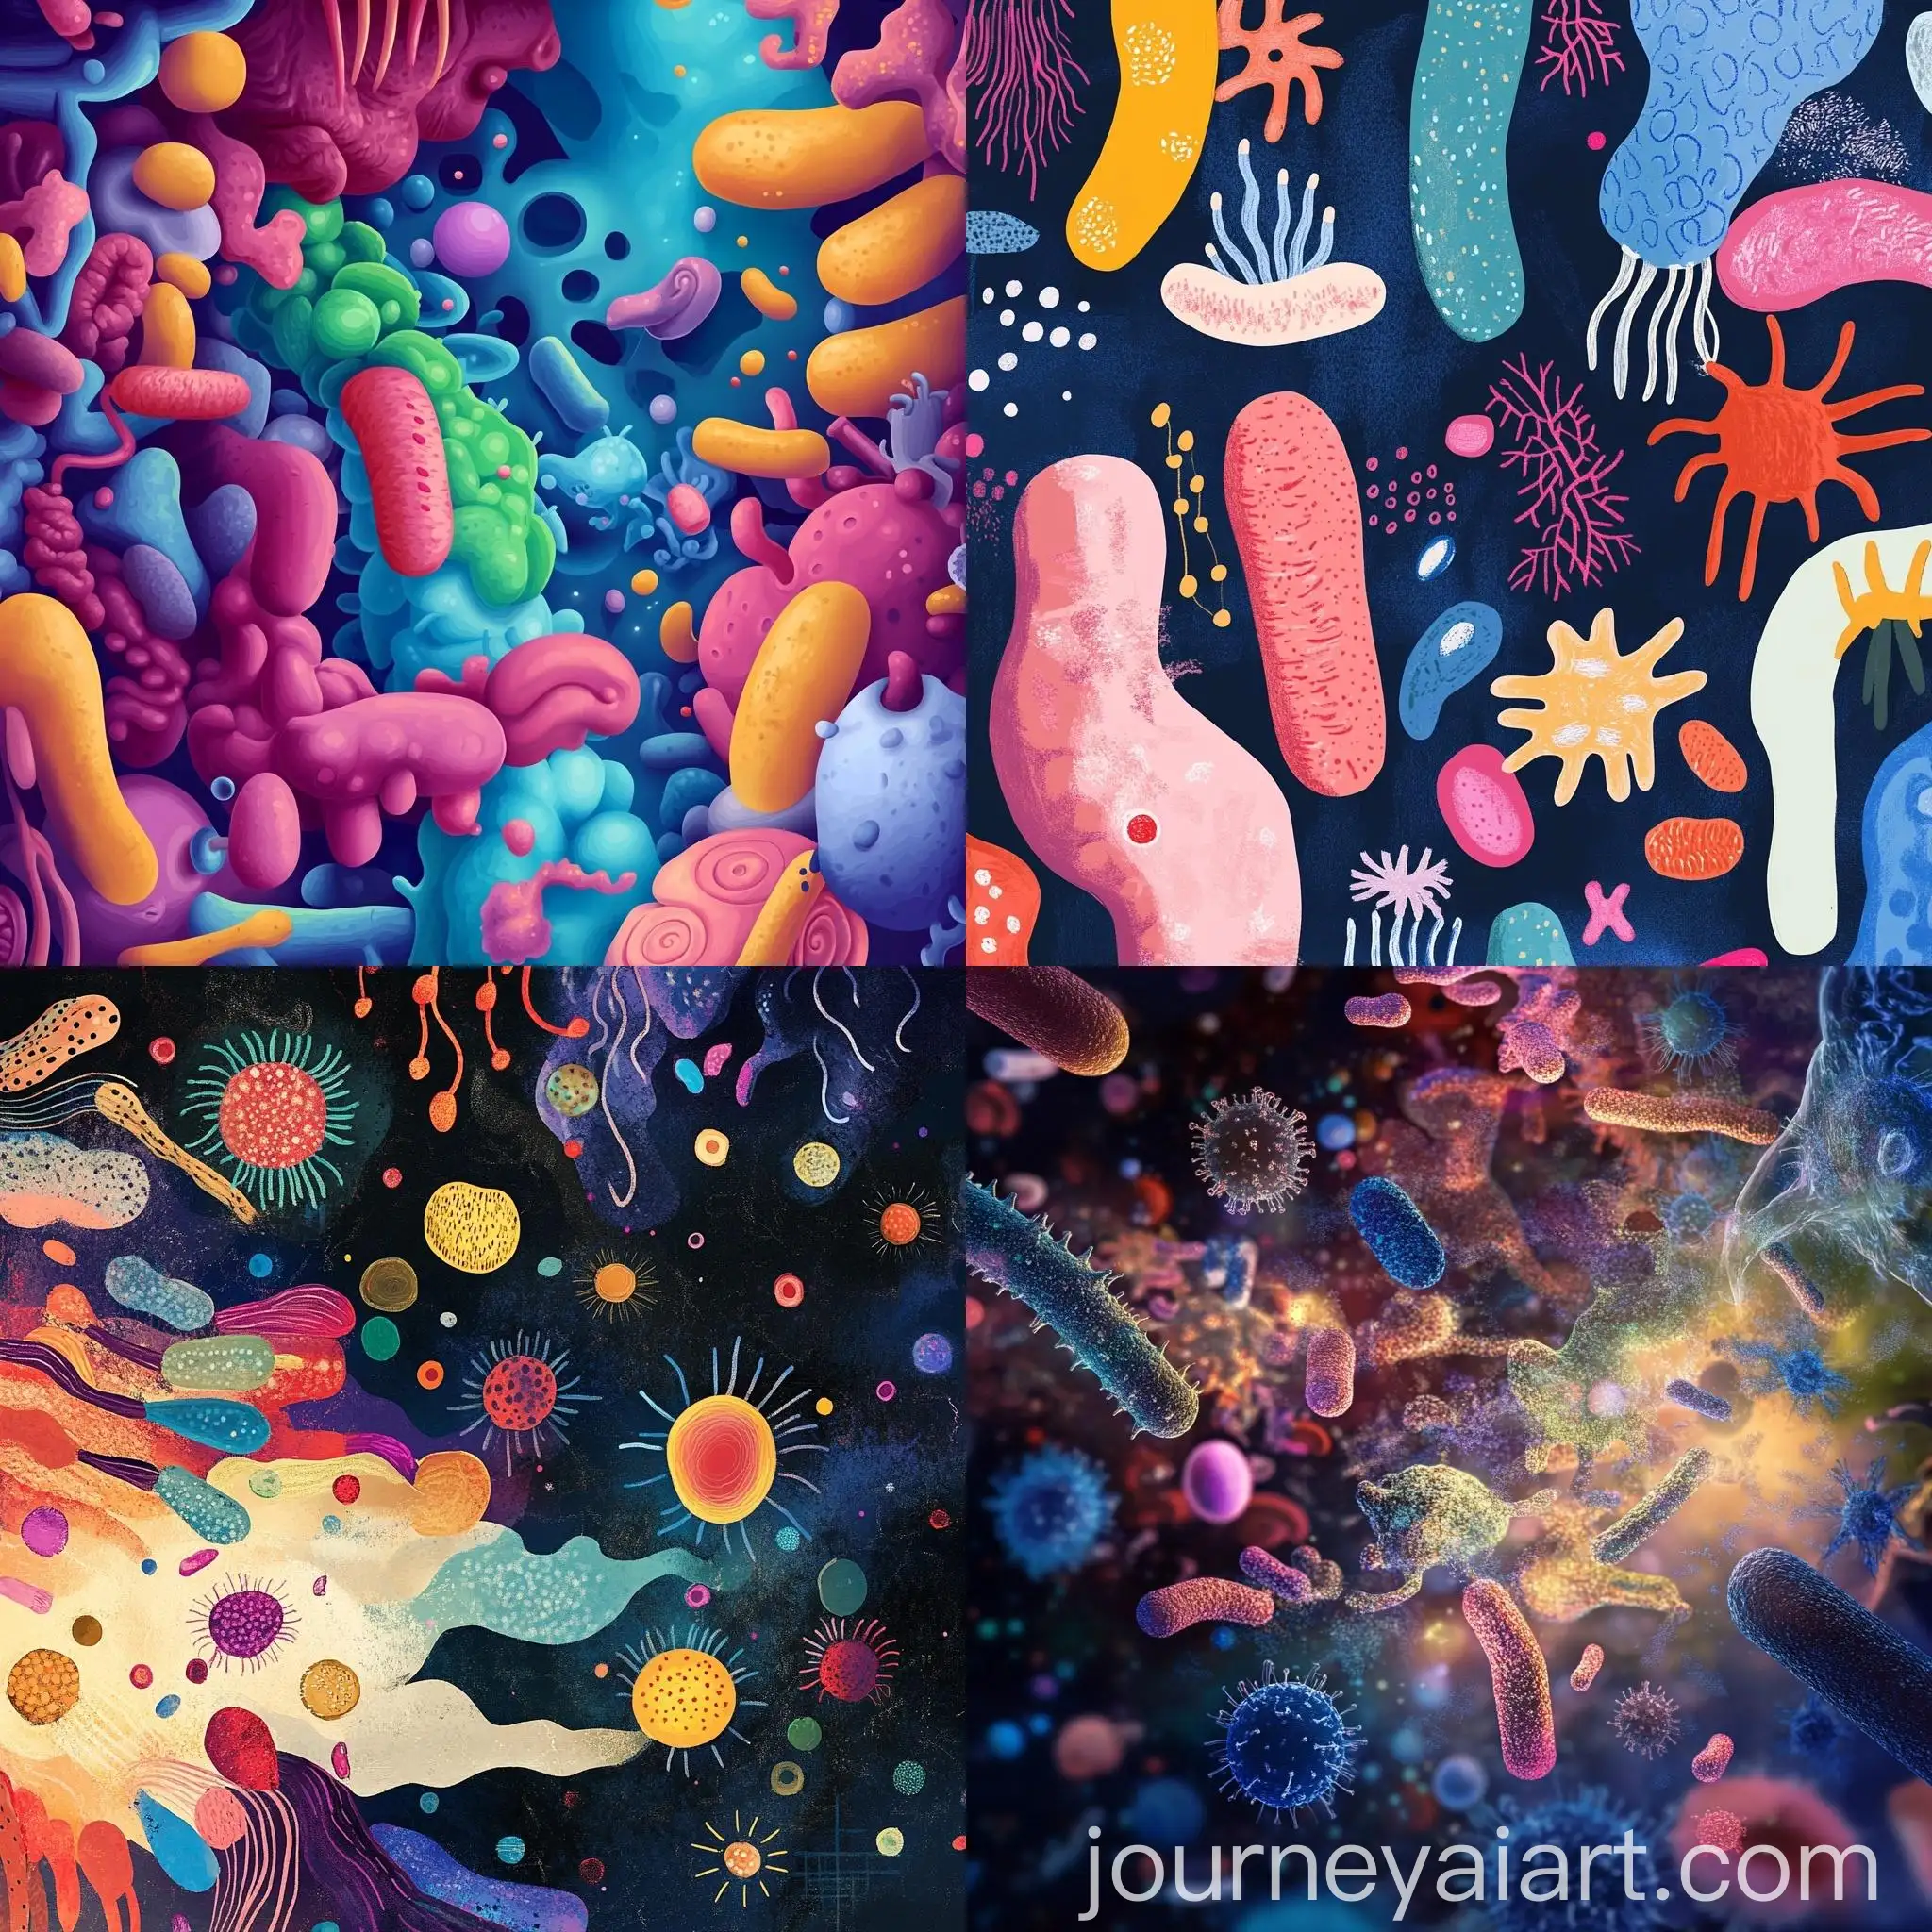
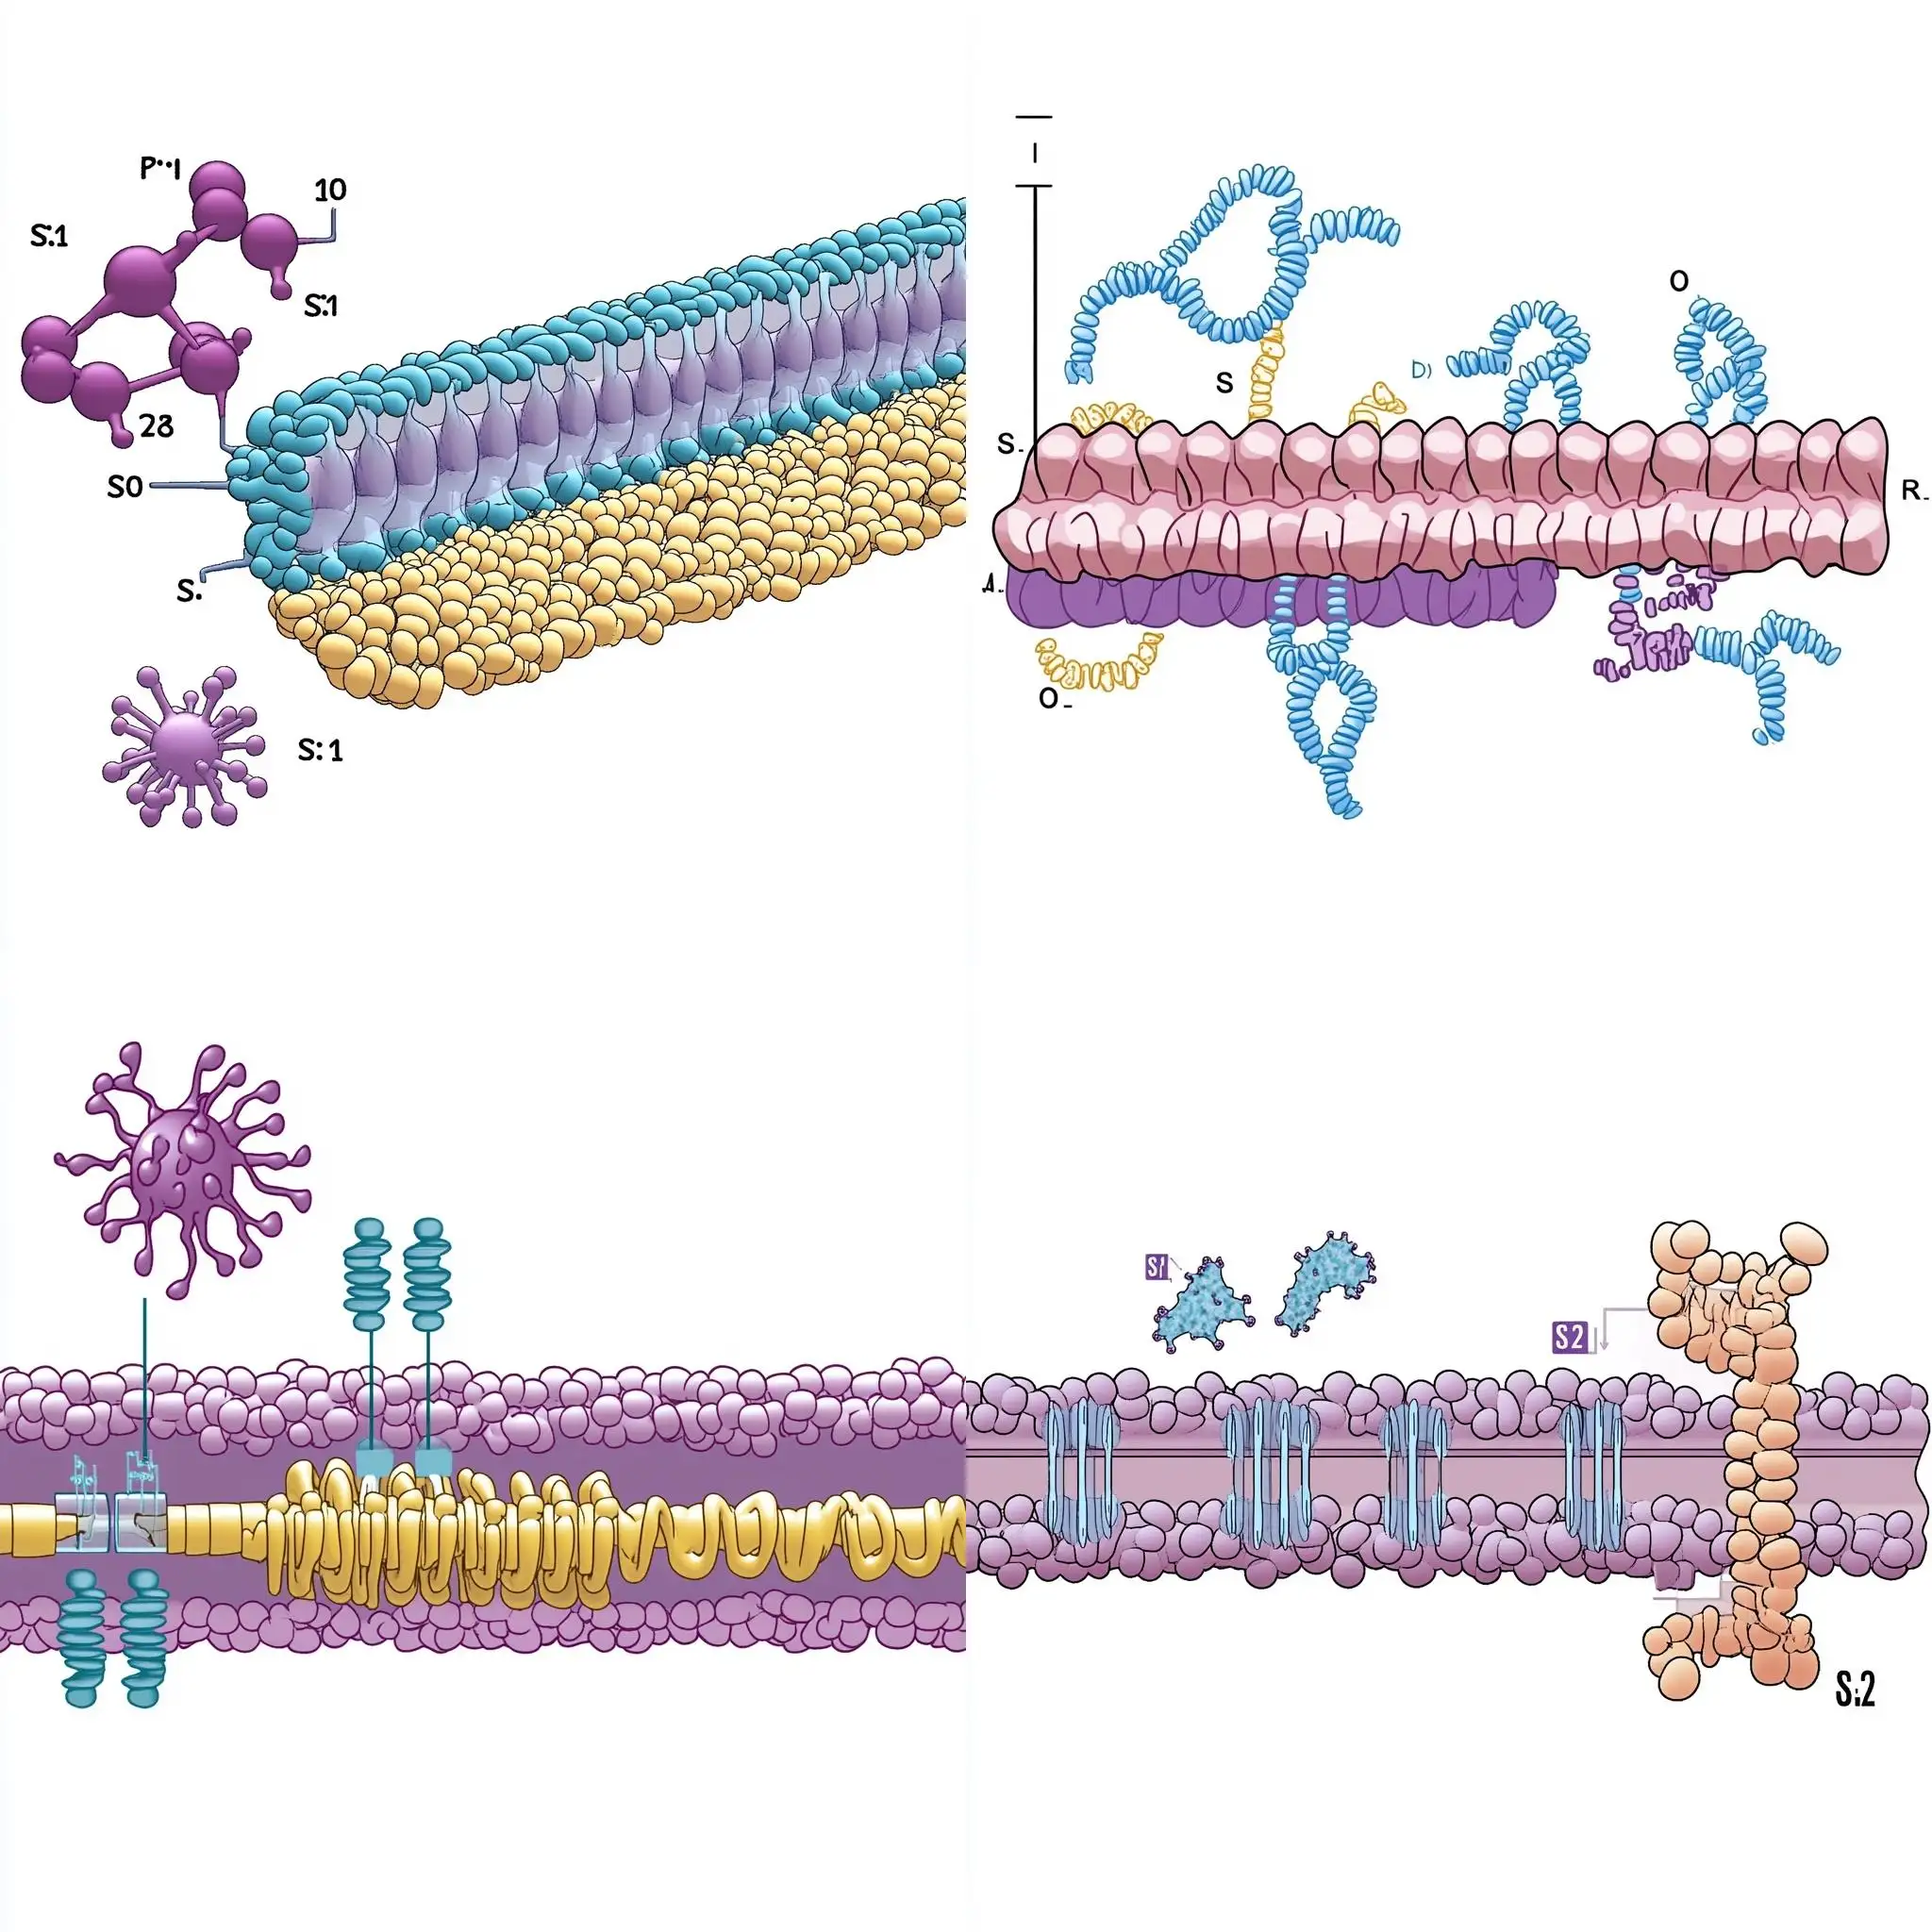
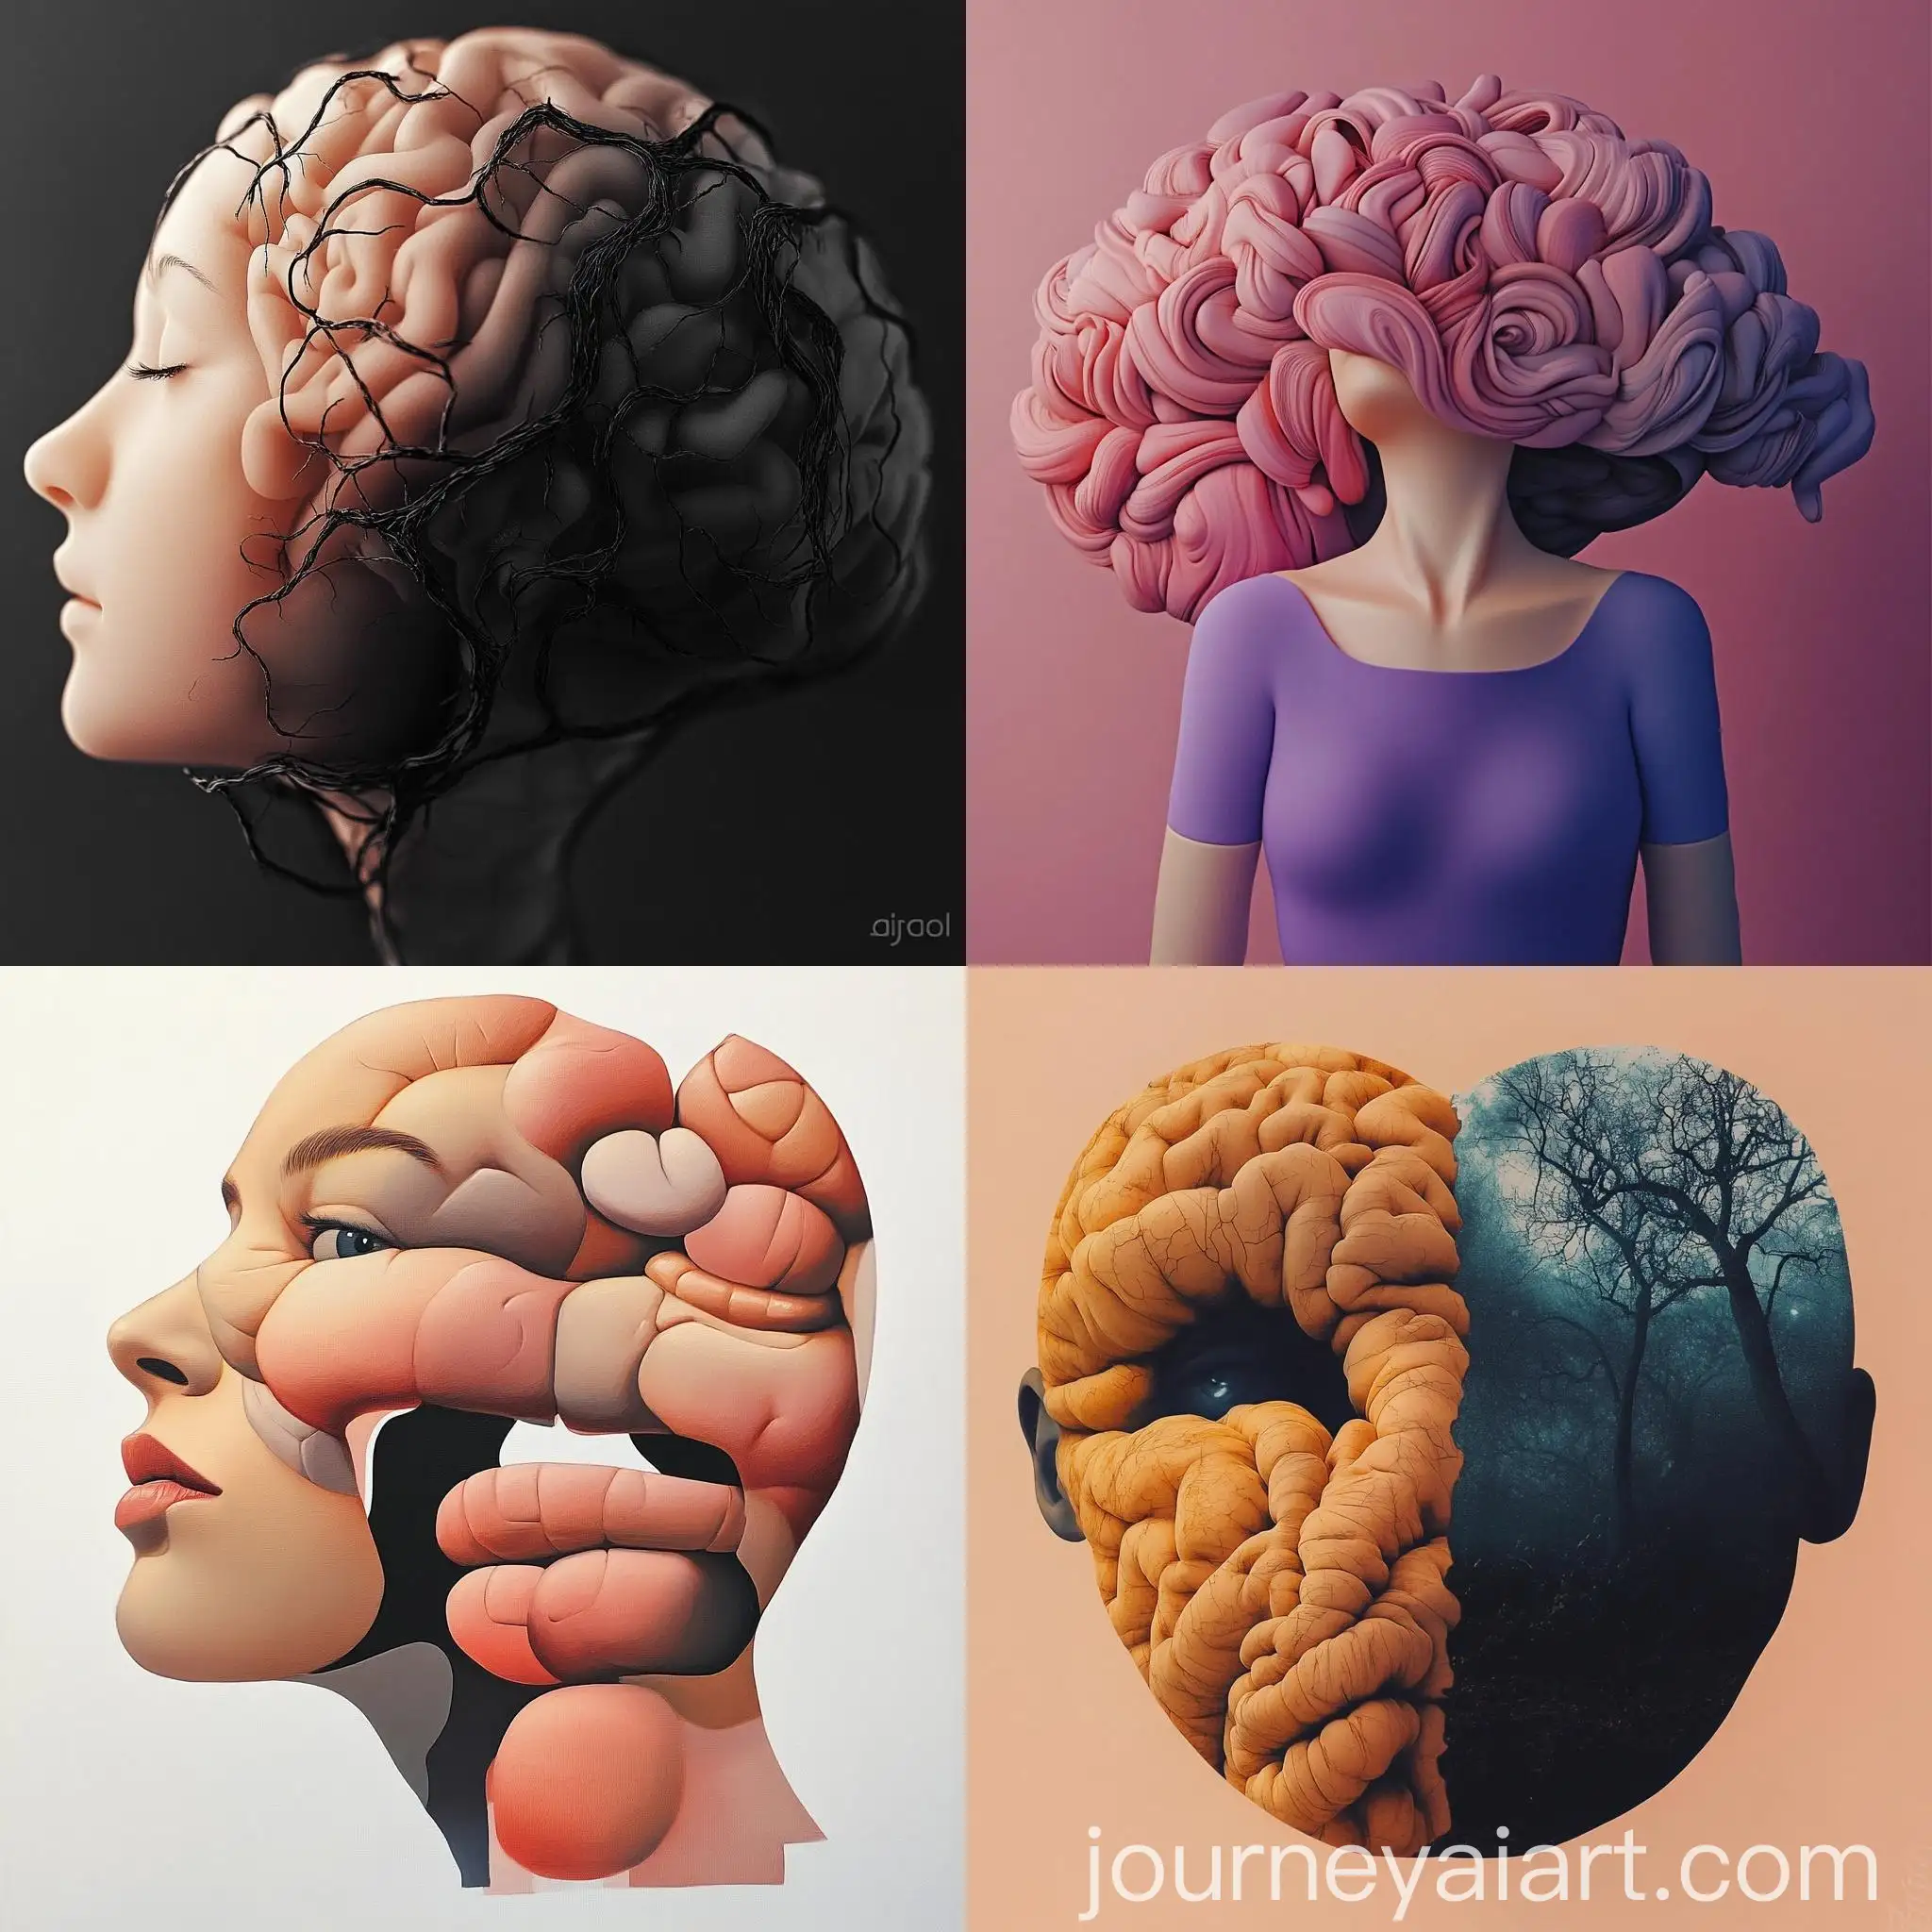
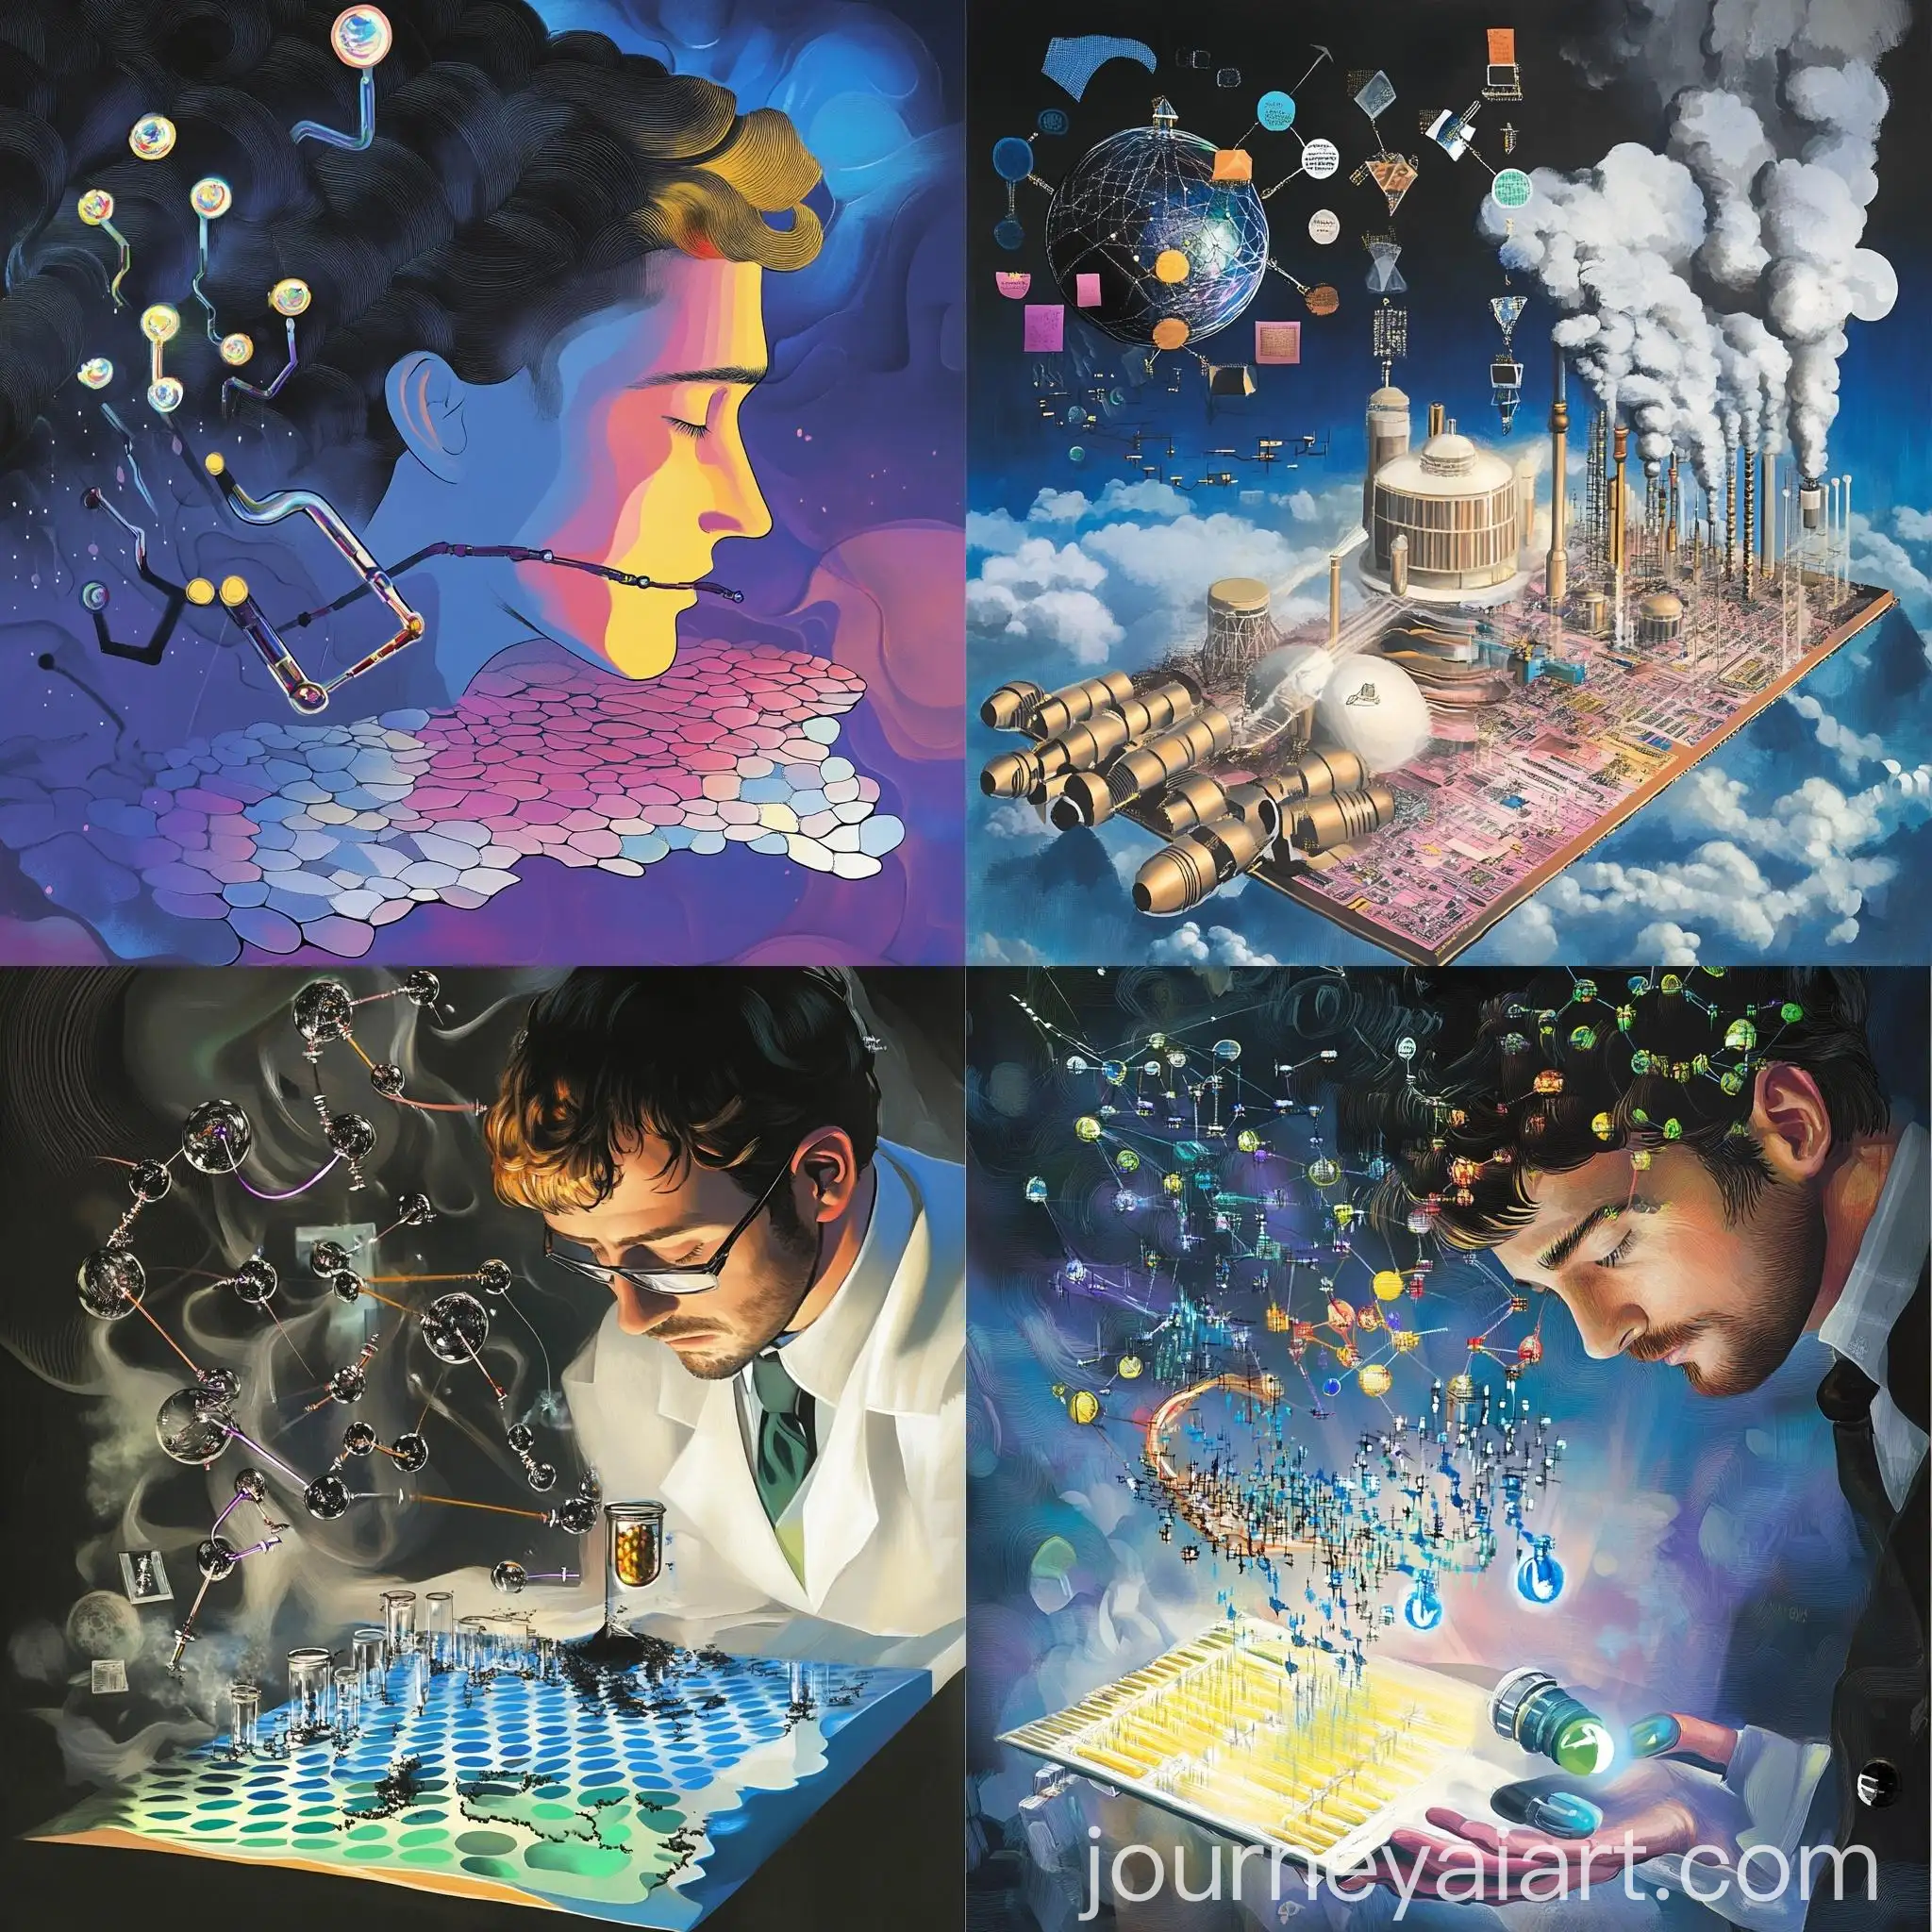
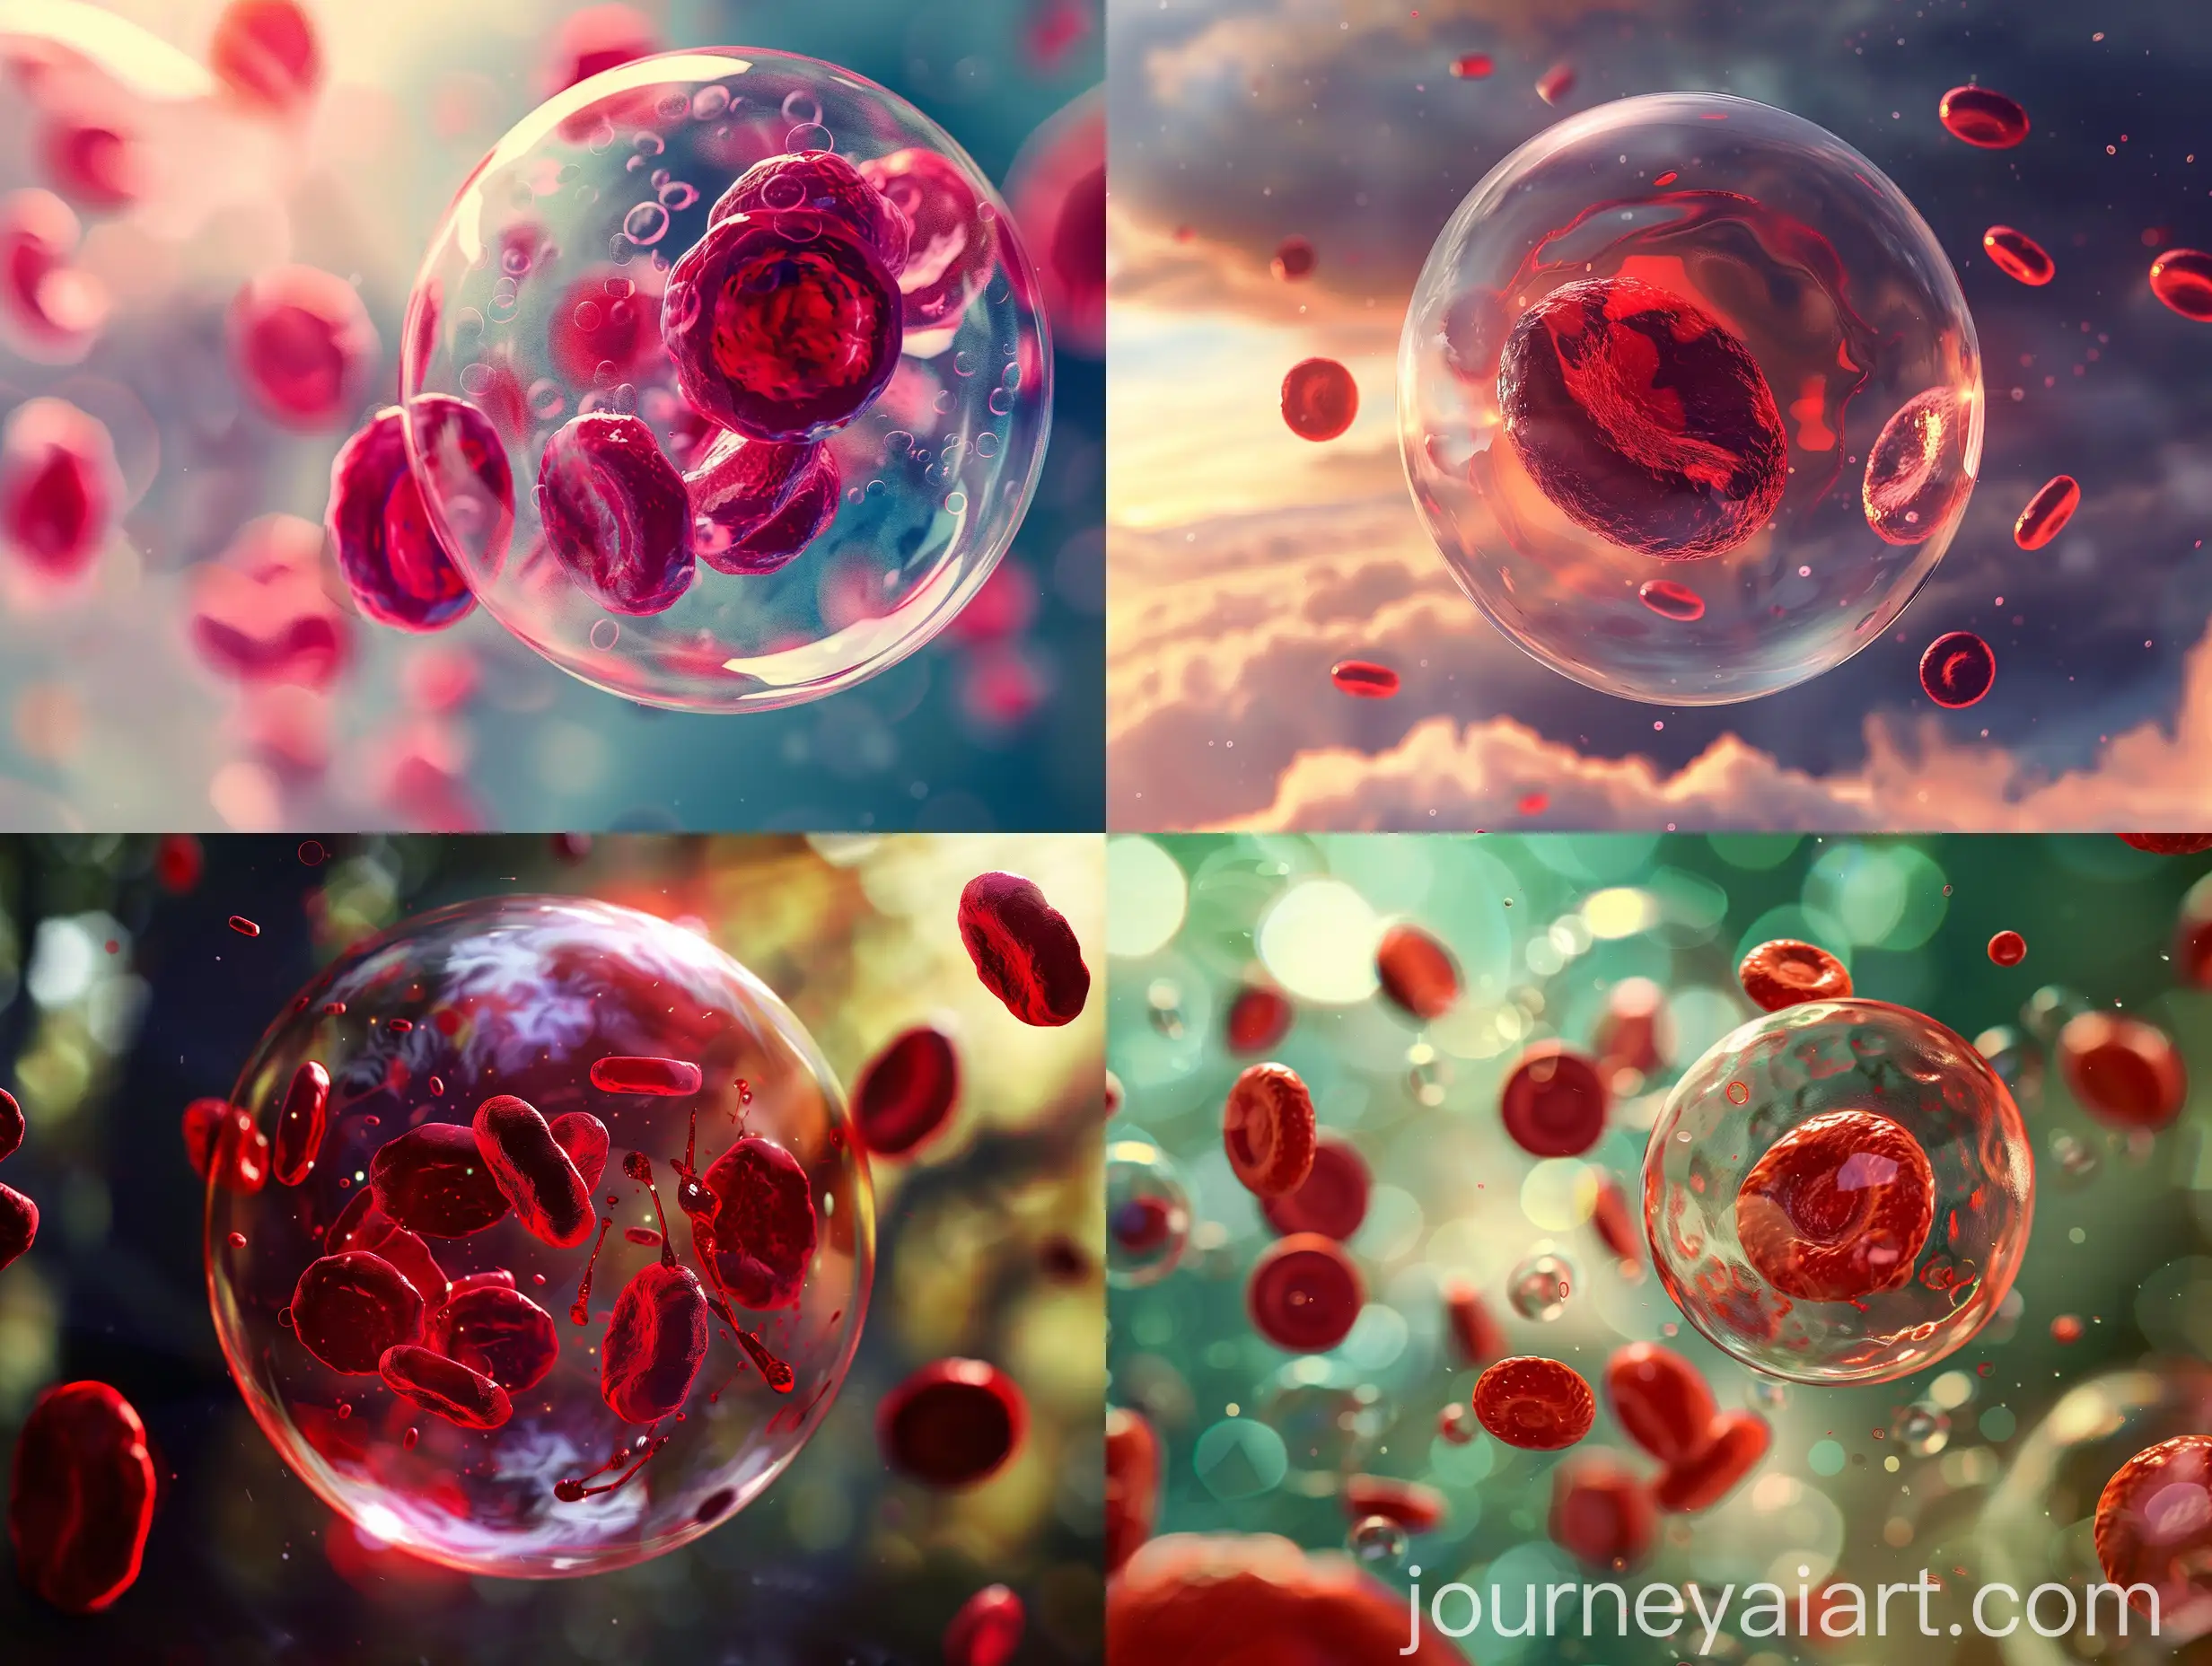
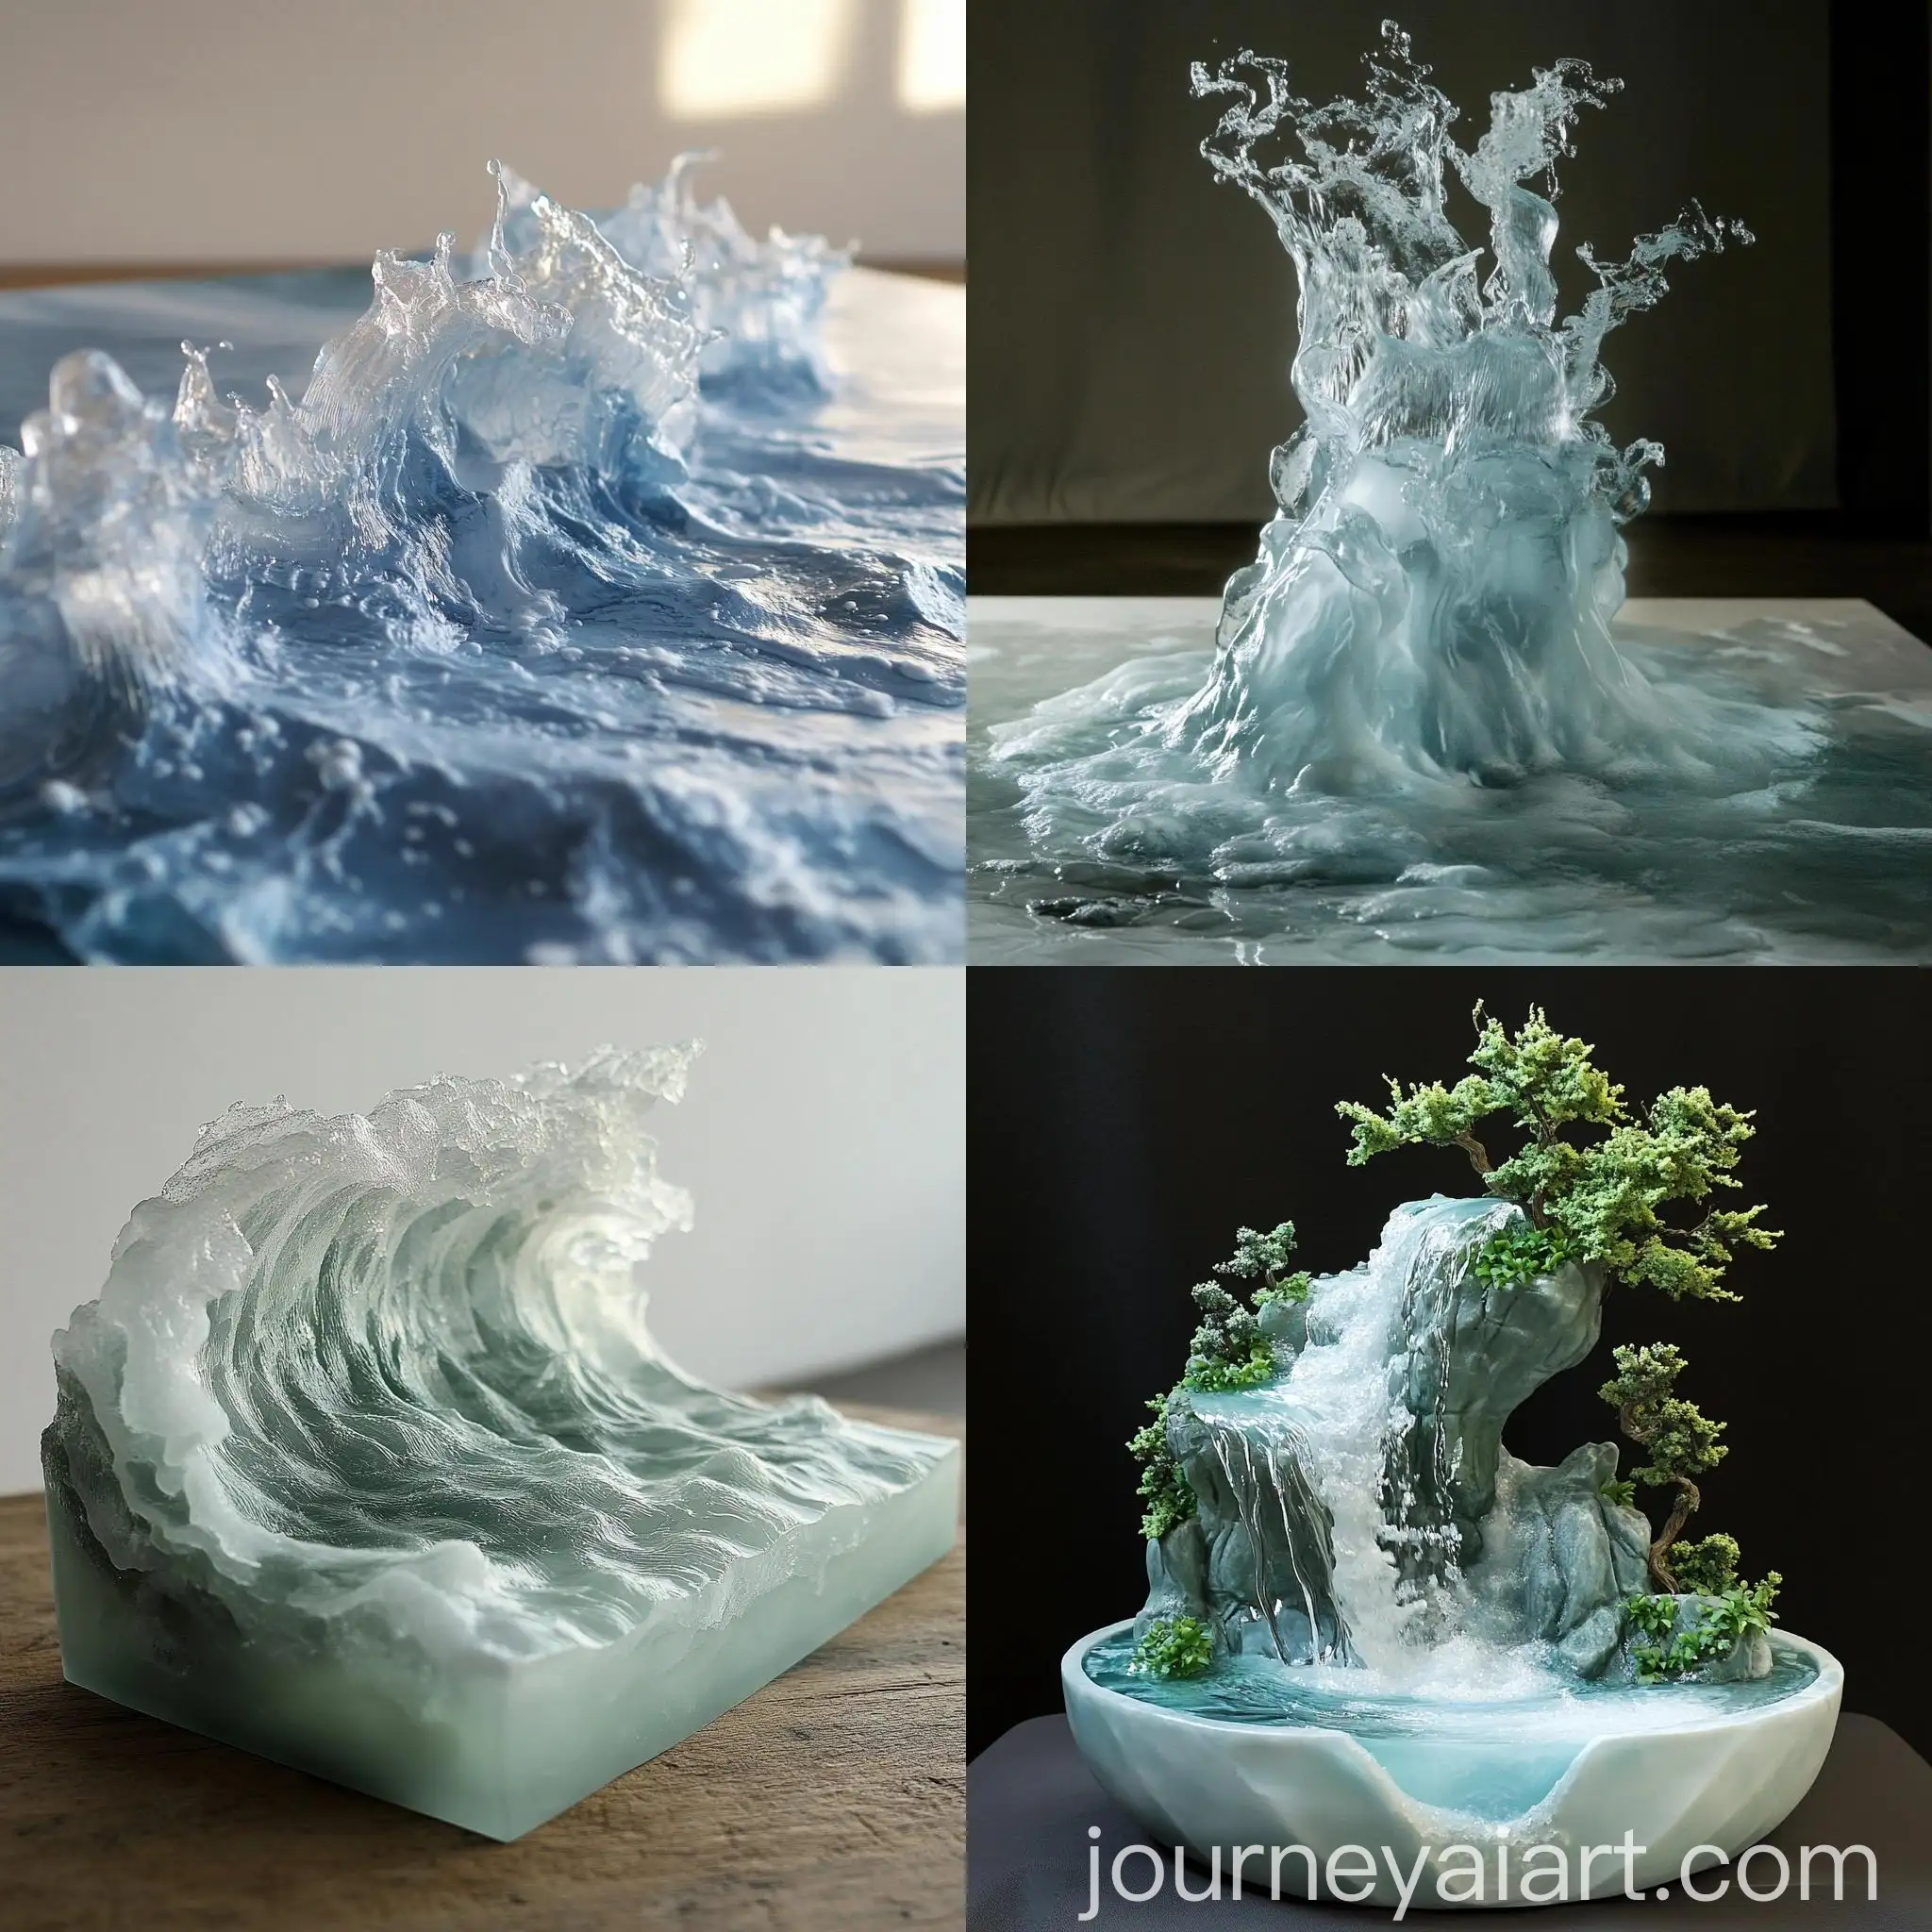
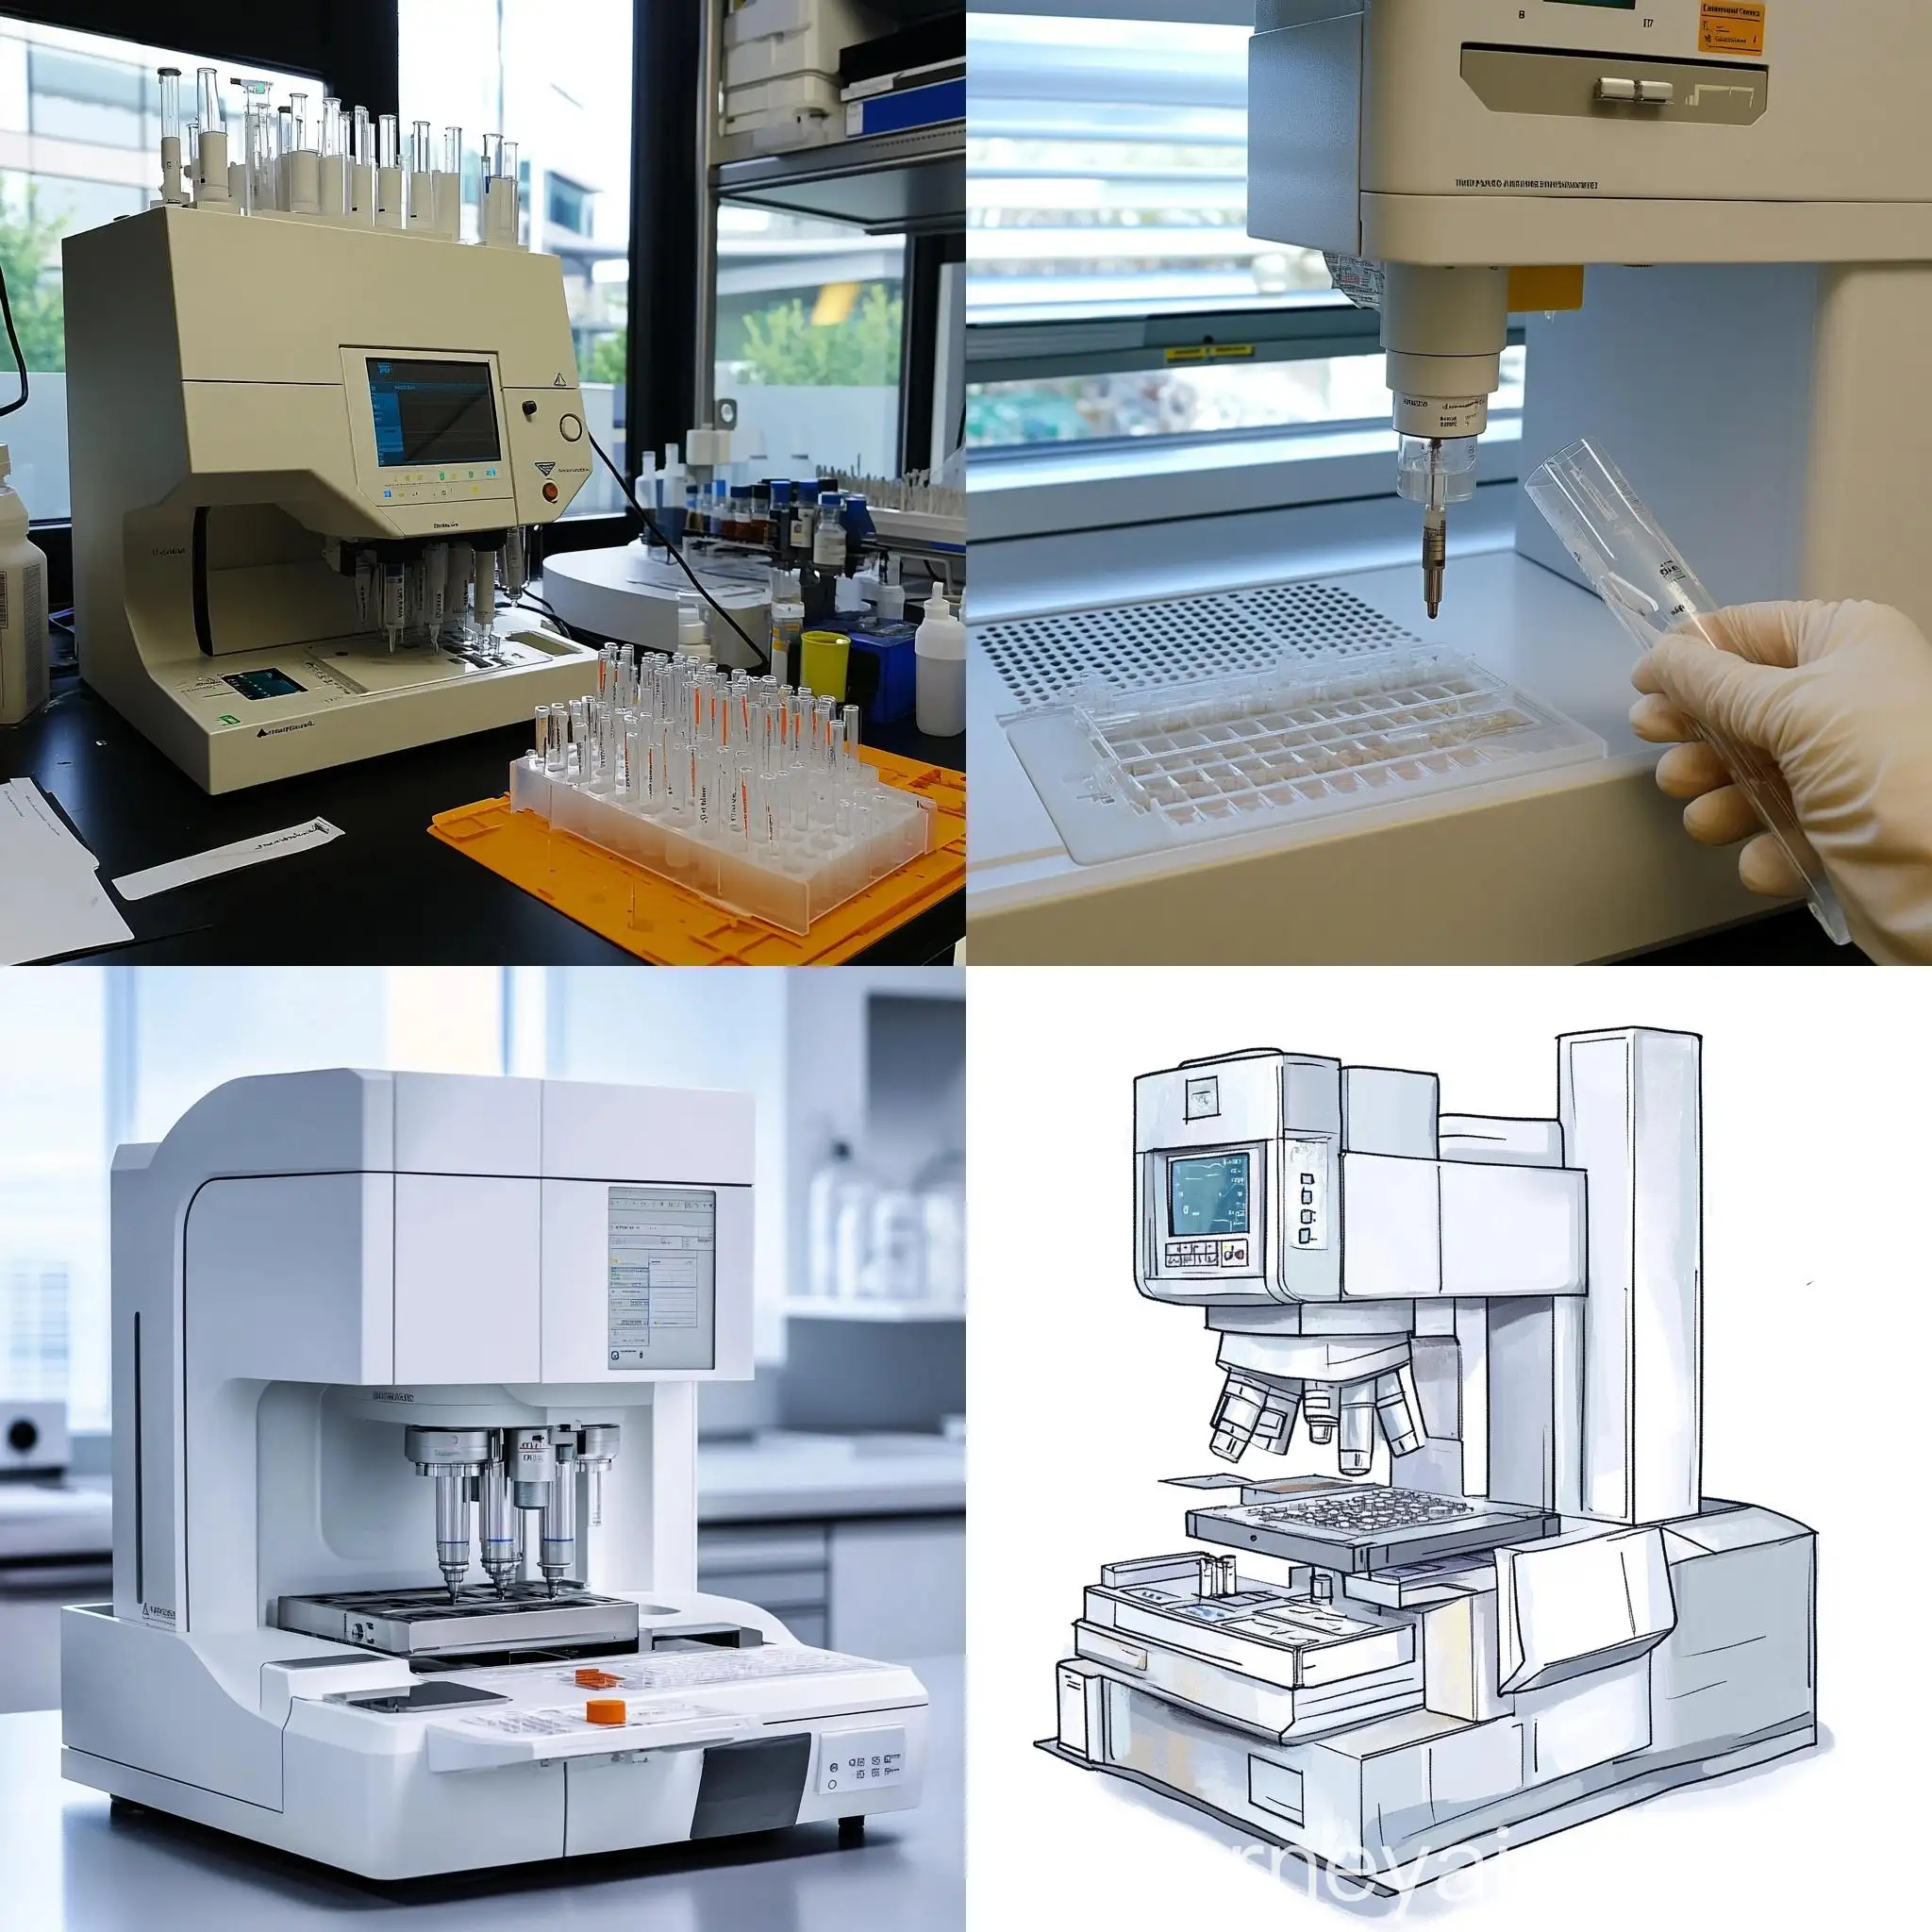
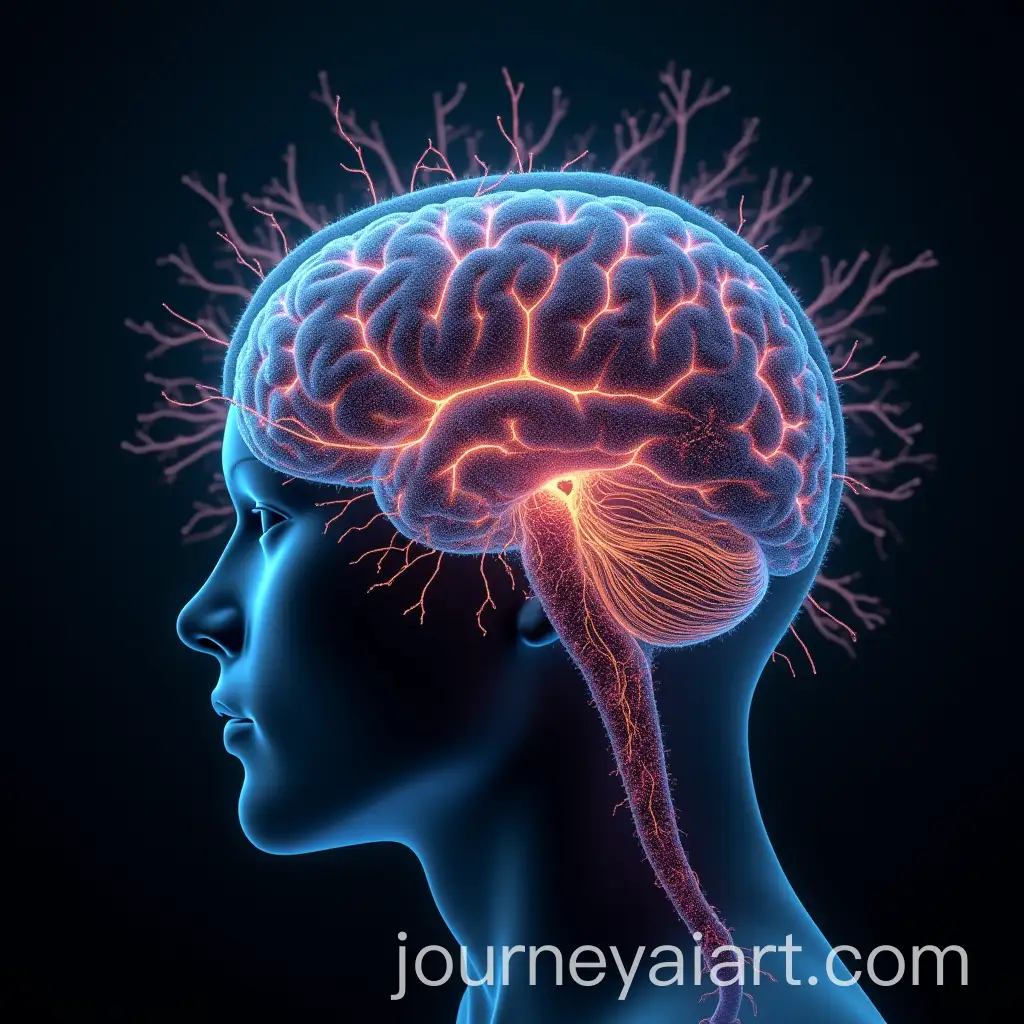
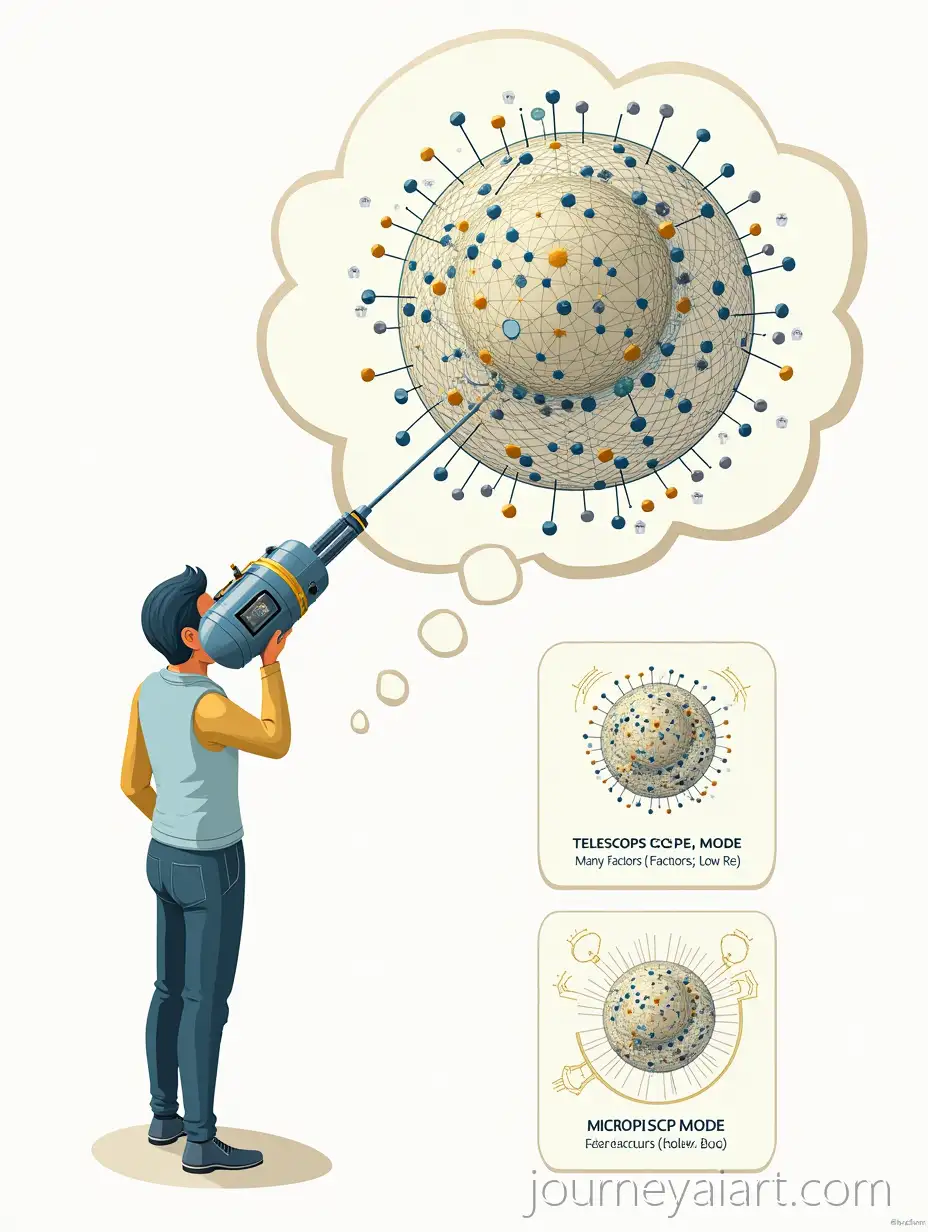
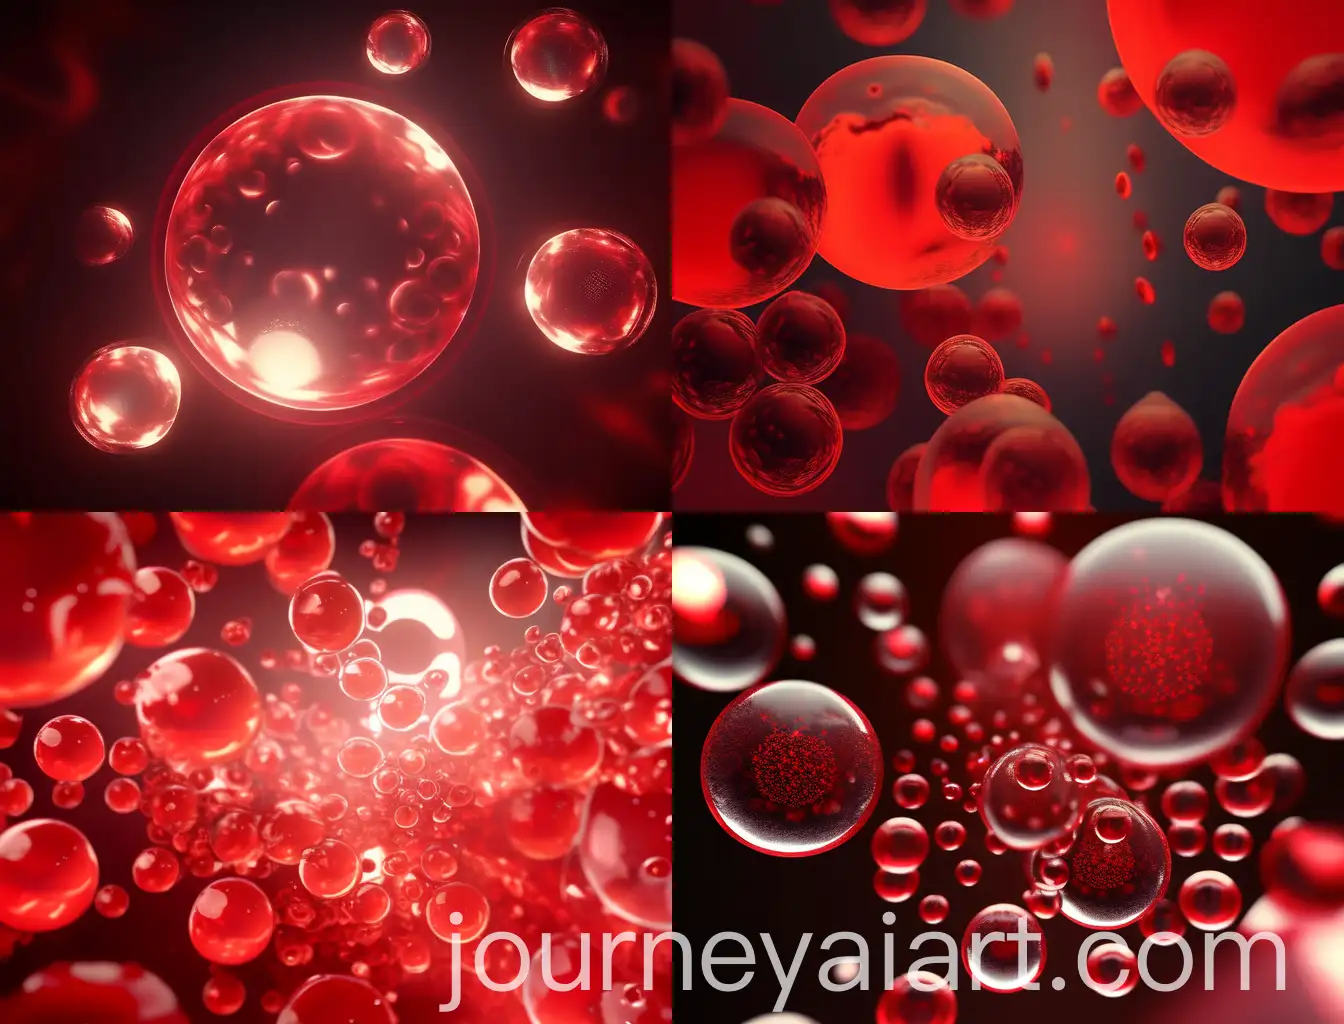
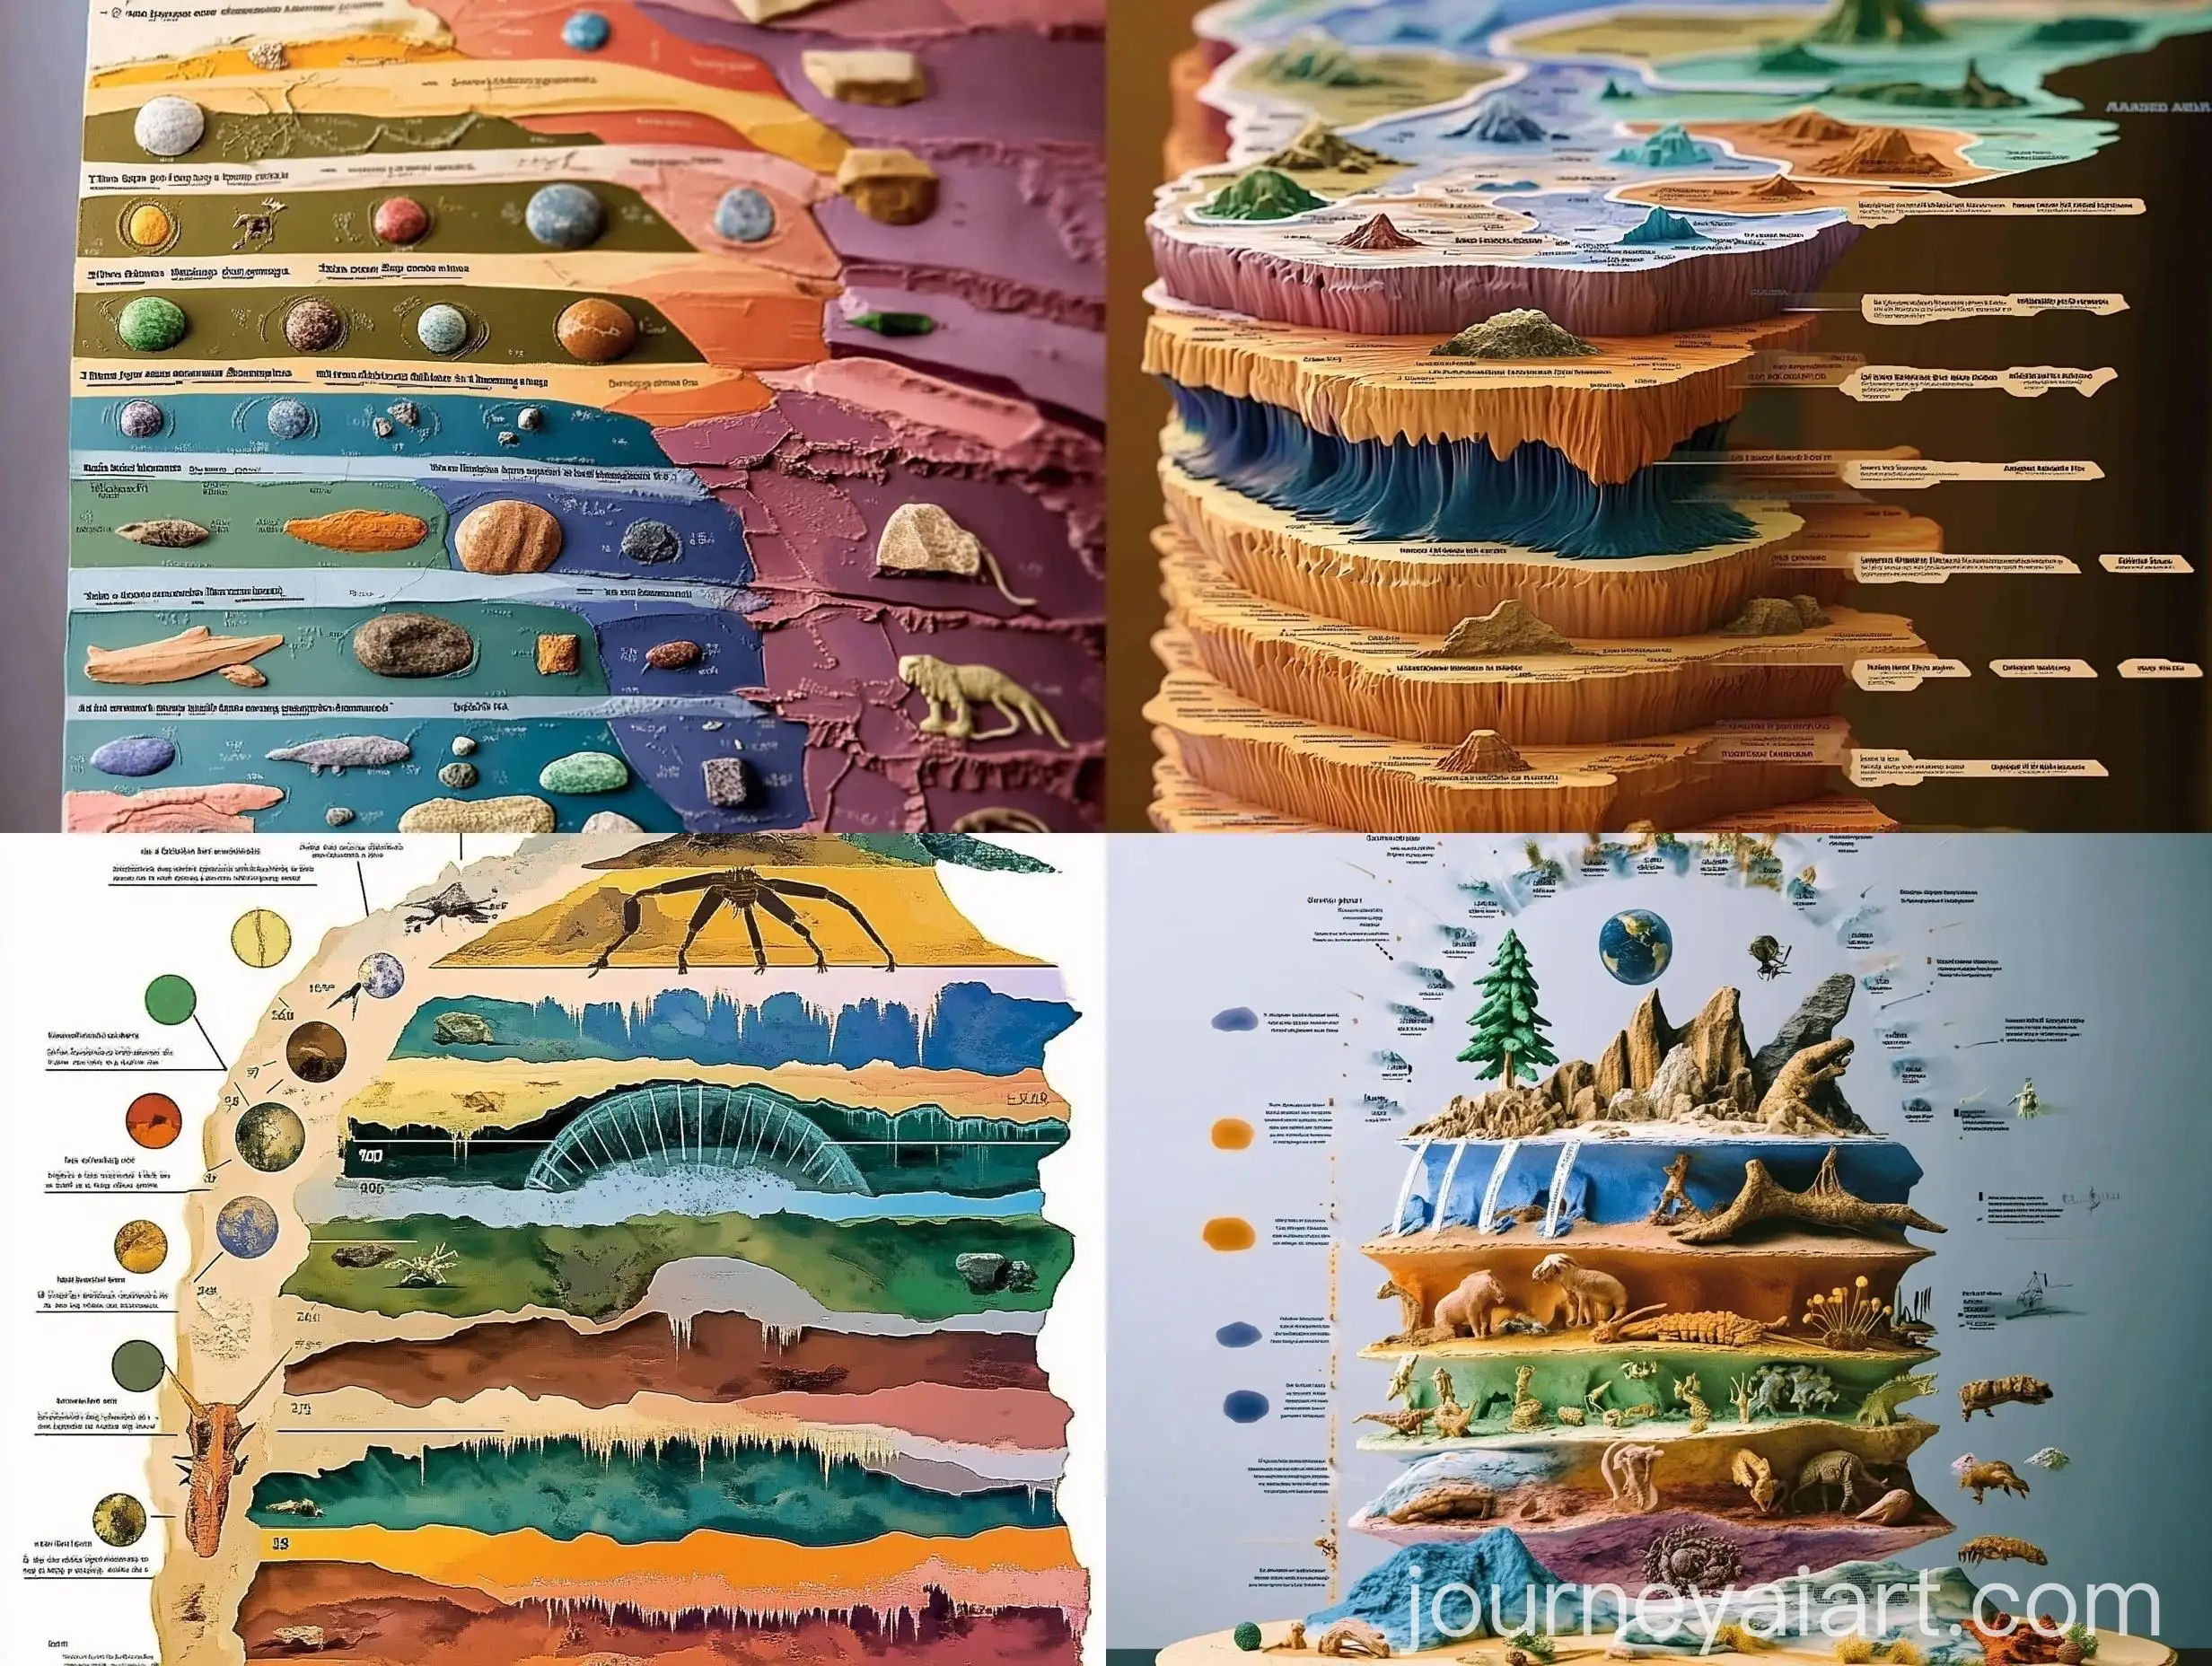
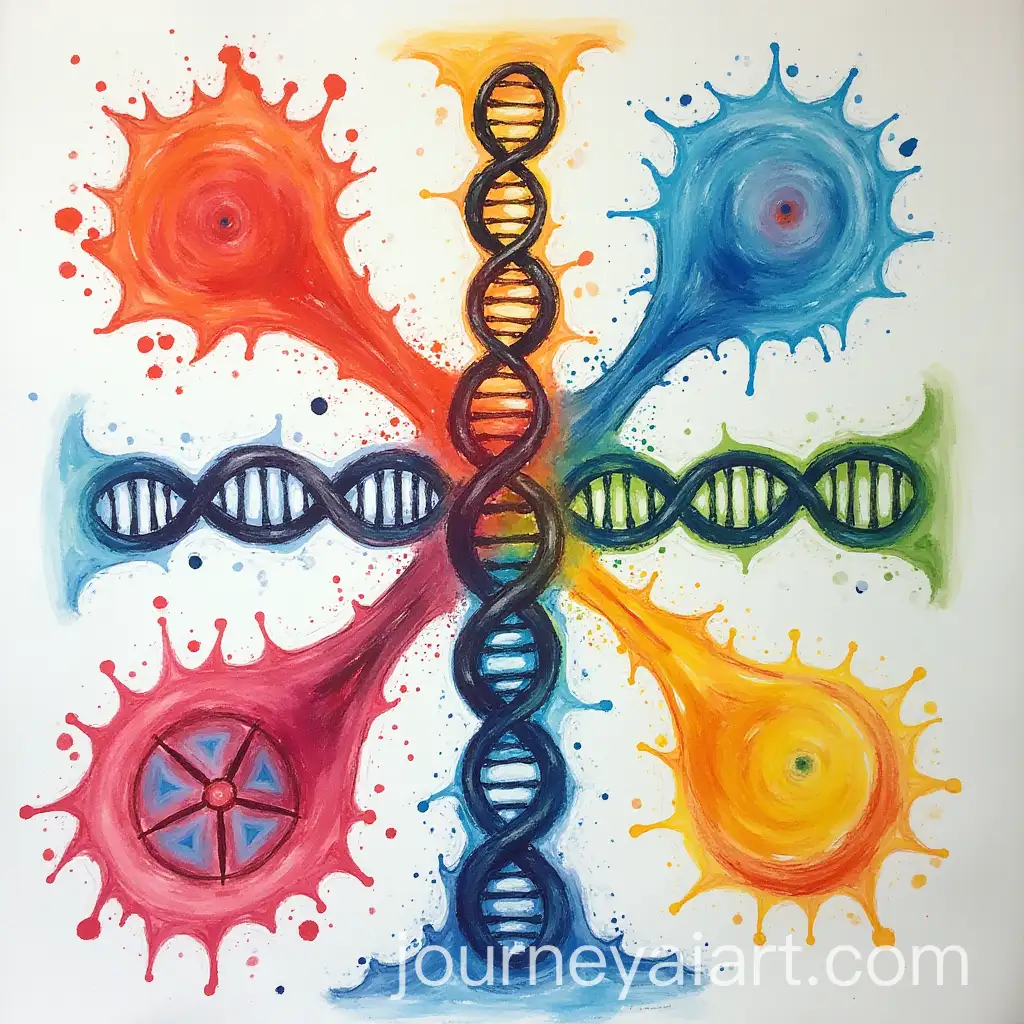
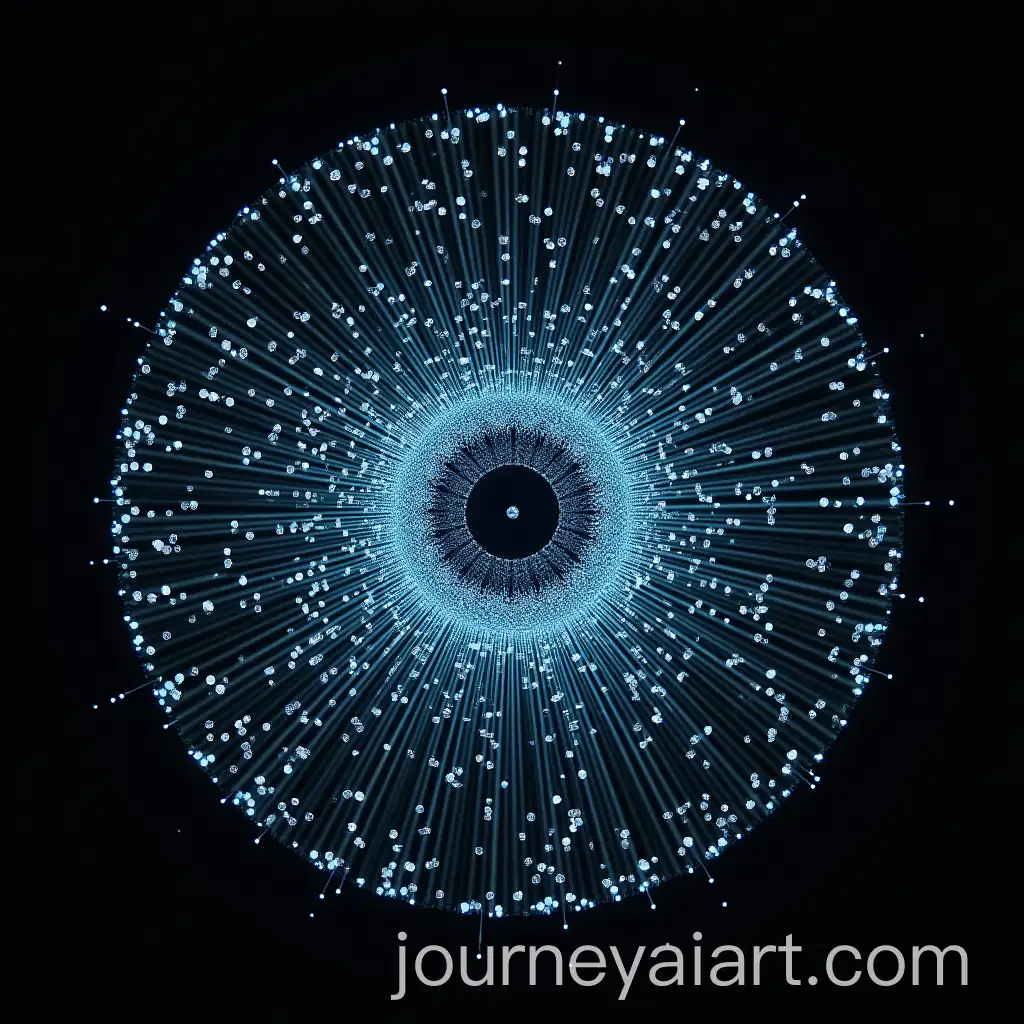
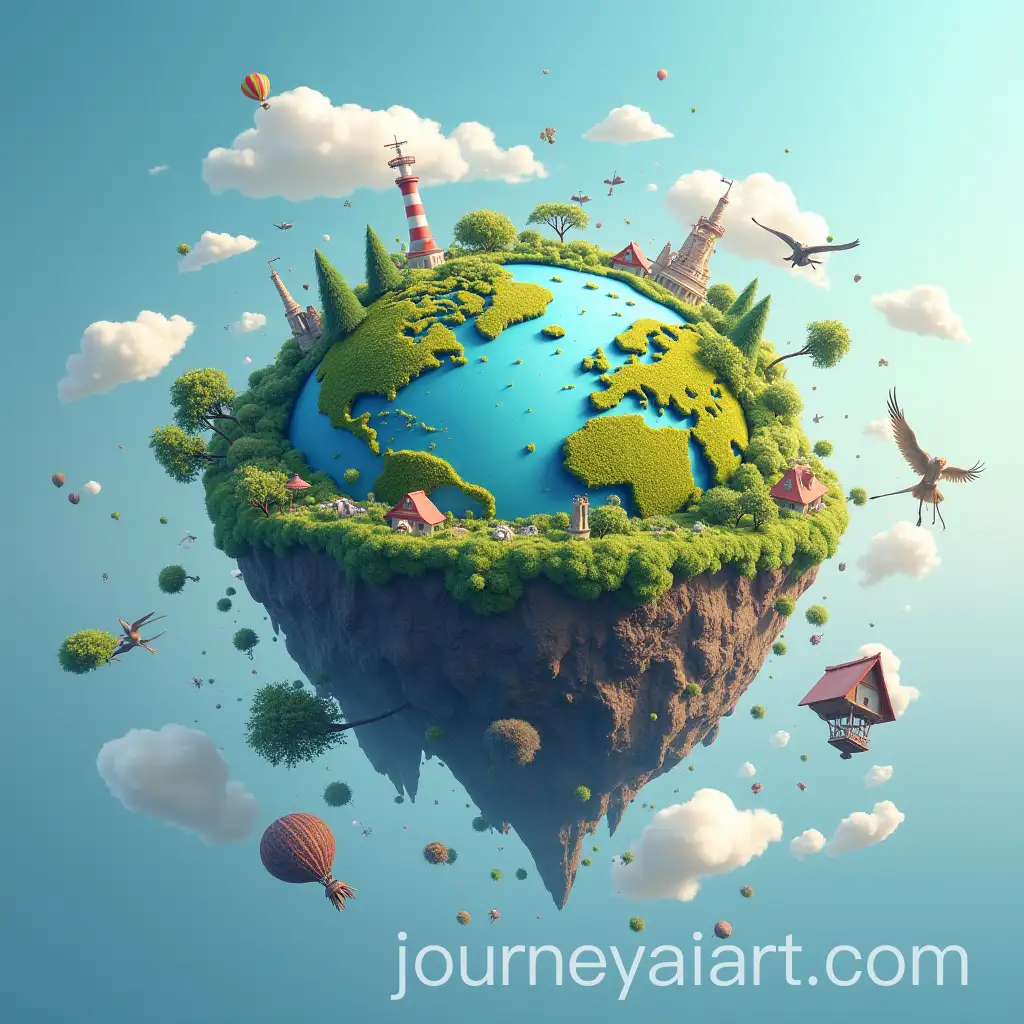
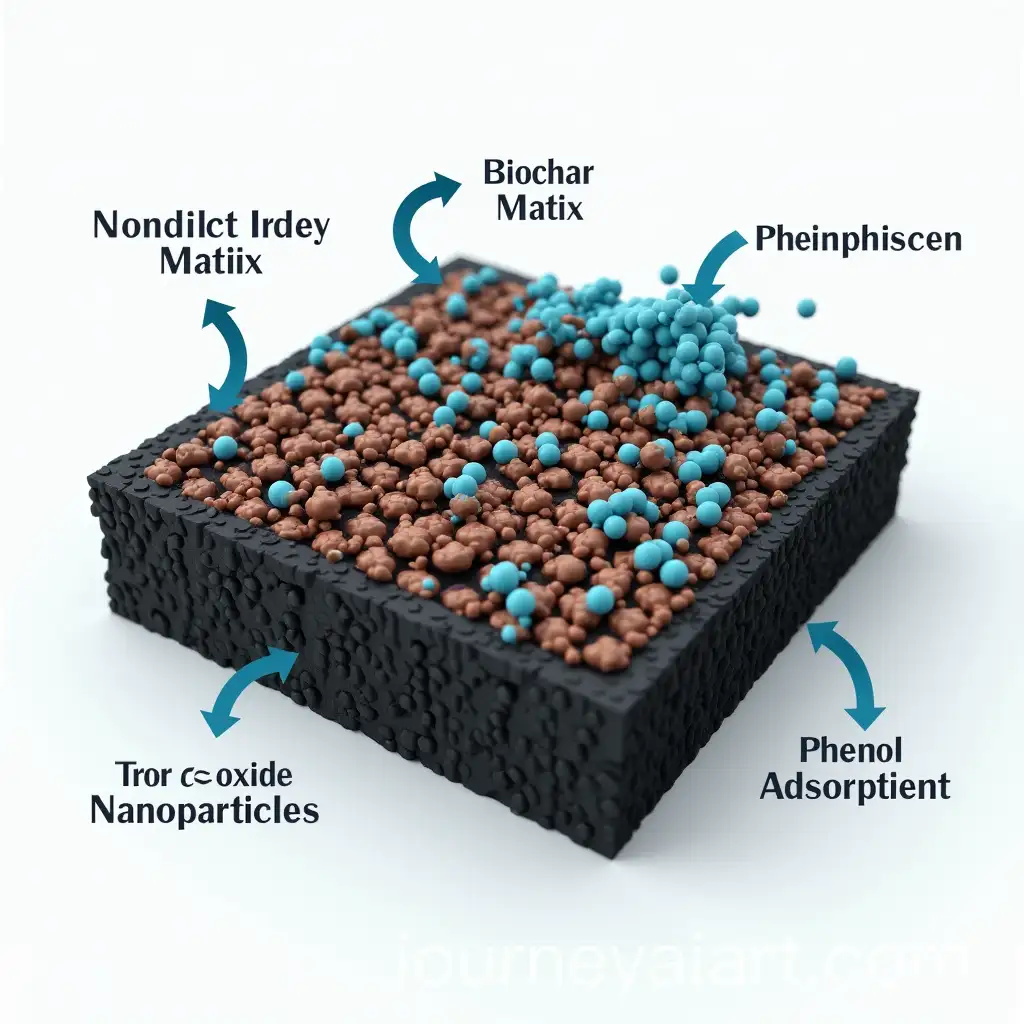
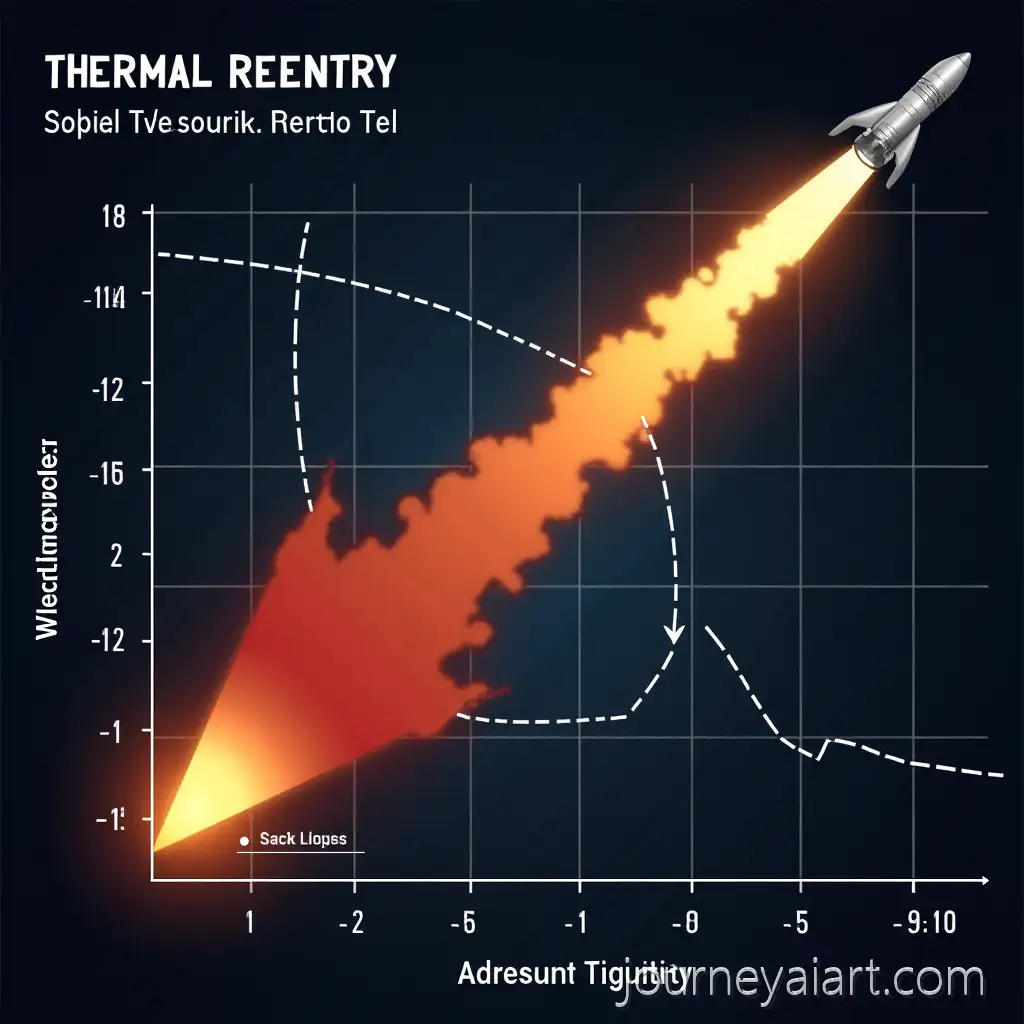
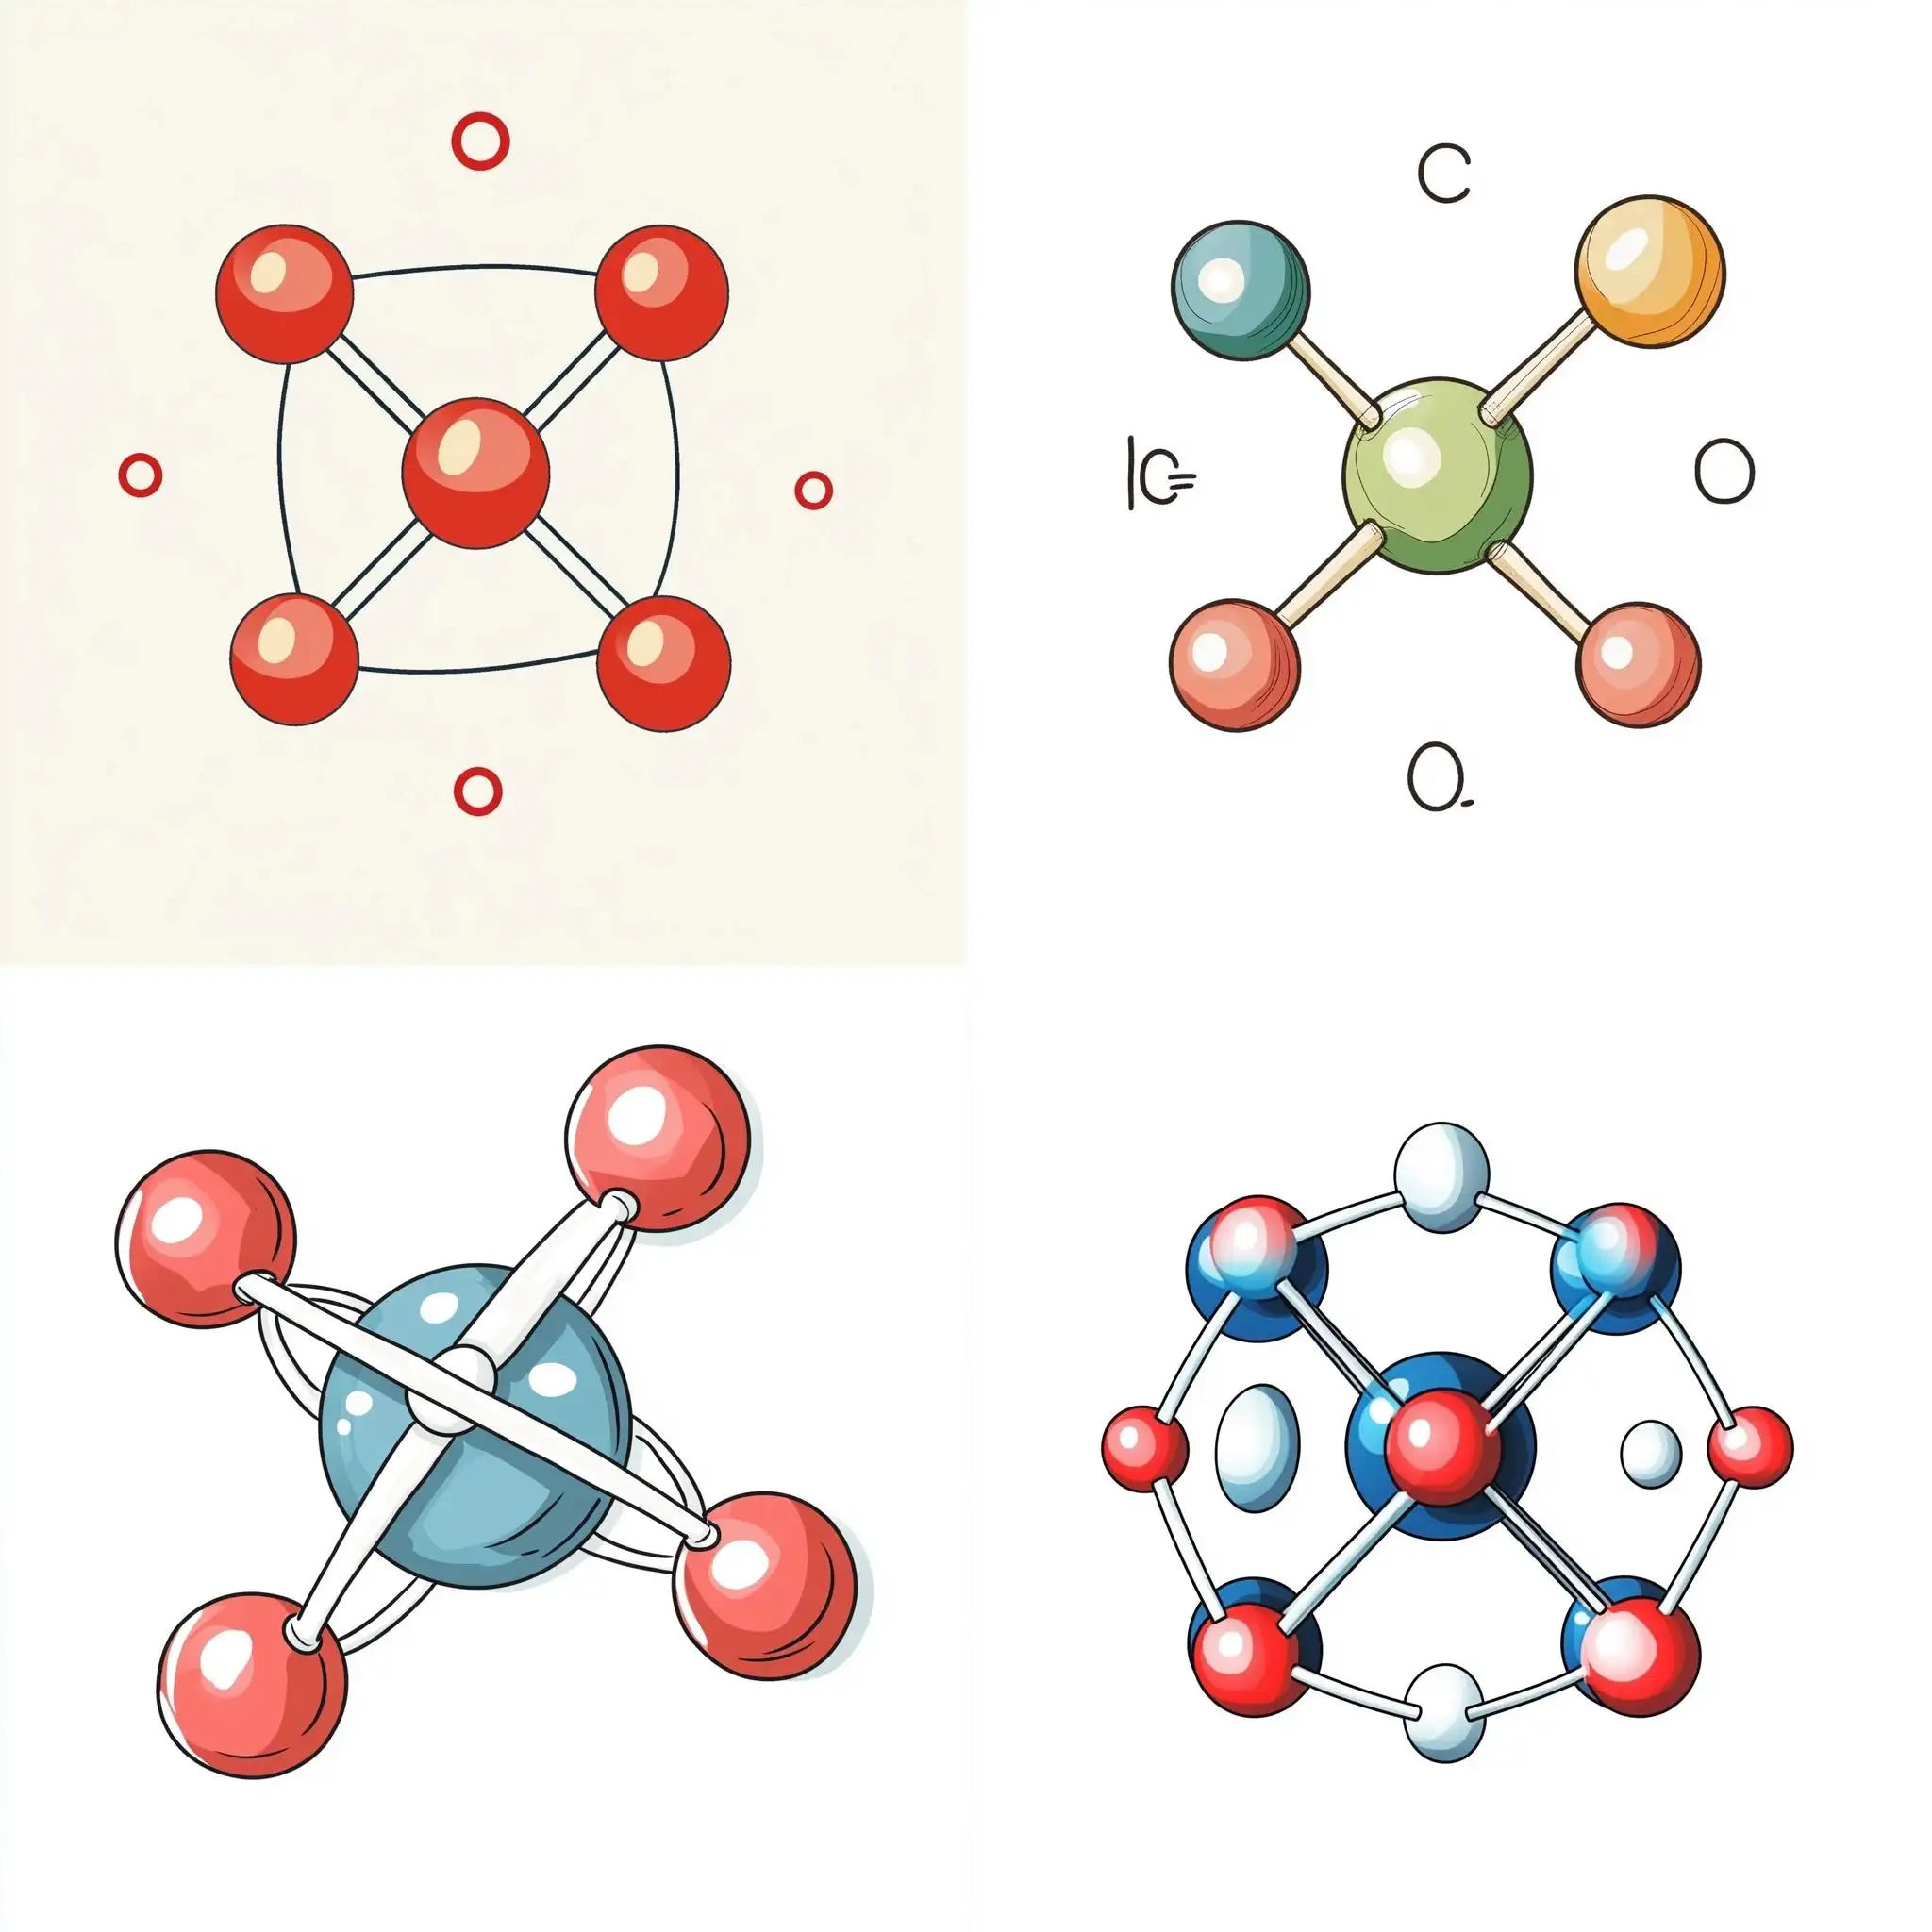
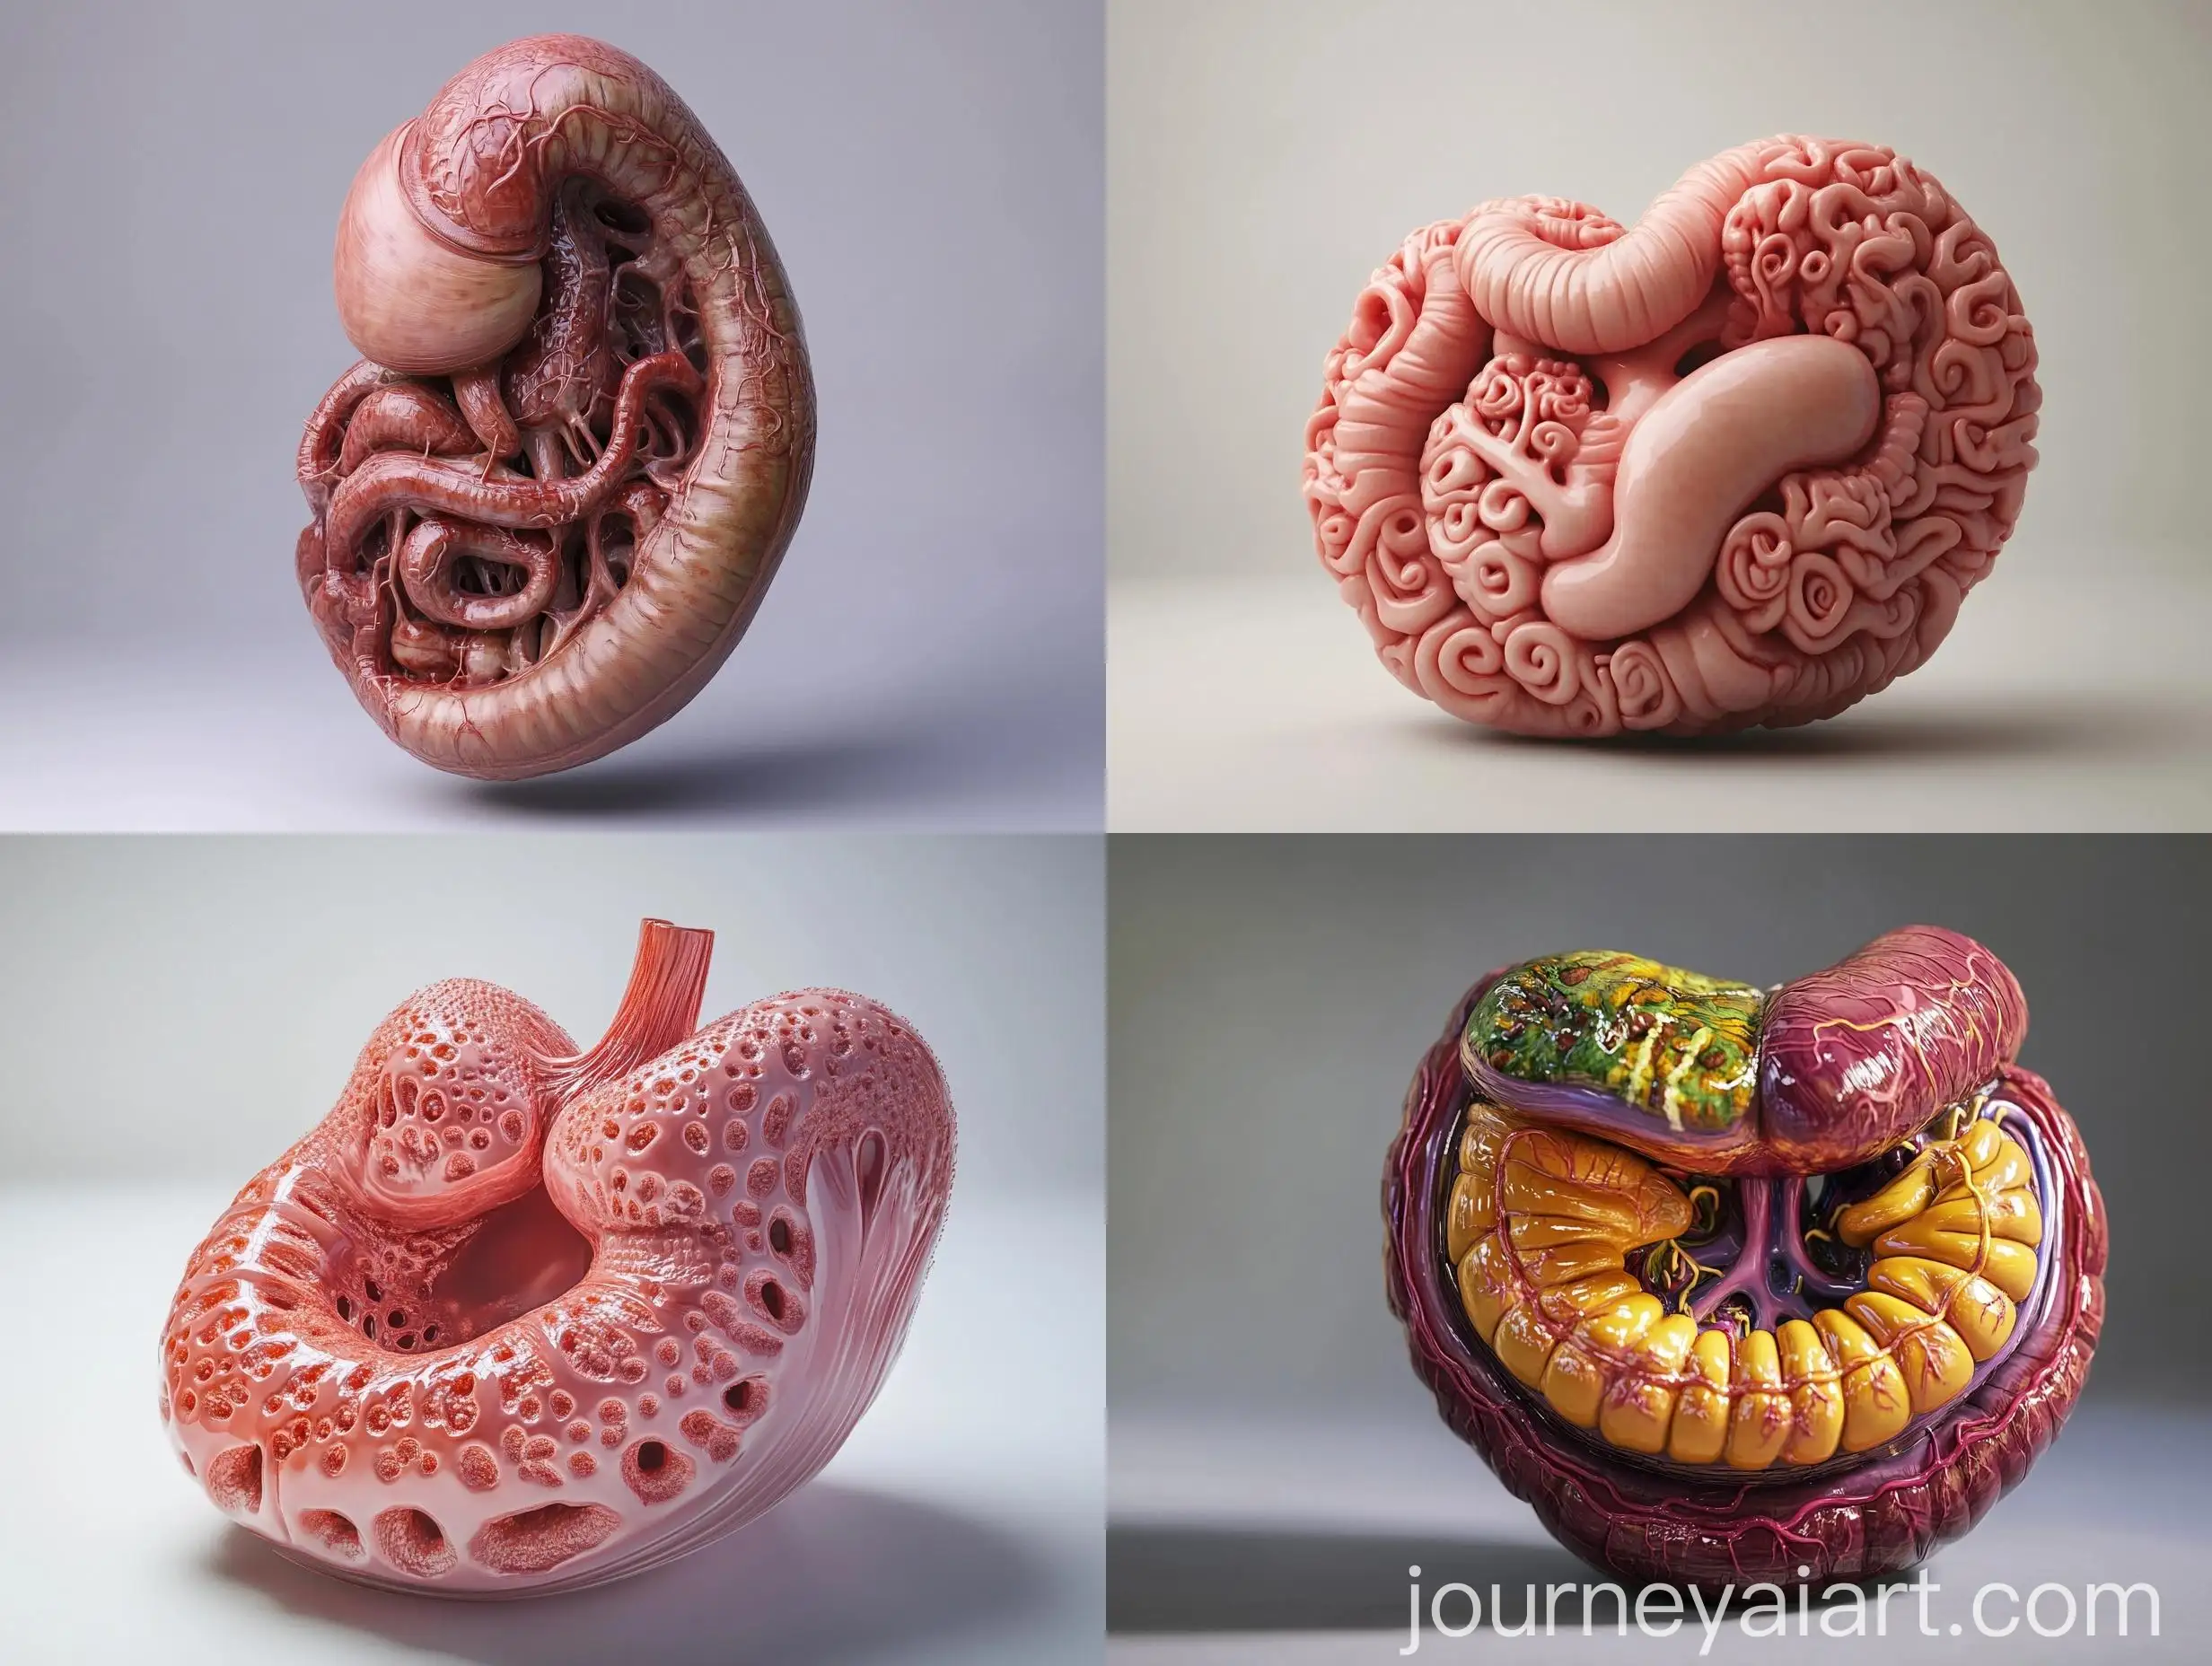
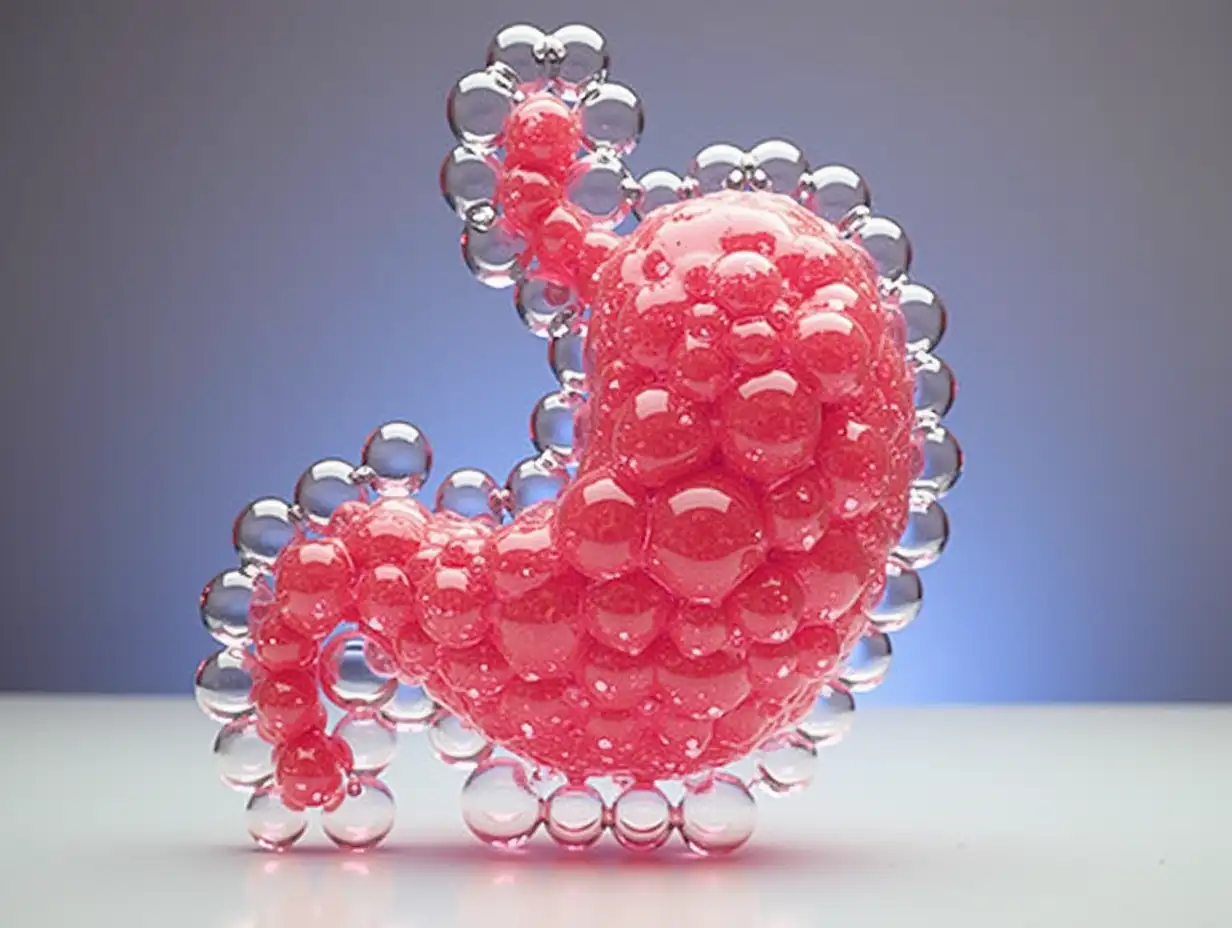
Scientific Visualization is a field of study that focuses on graphically representing scientific data to enable easier understanding and analysis. It involves creating visual representations of complex datasets using techniques such as 3D rendering, graphical illustrations, and data mapping. These visuals are crucial in disciplines such as biology, chemistry, physics, and engineering, where they help to interpret data patterns, structures, and trends that might not be immediately apparent from raw data alone.
What is Scientific Visualization?
Scientific Visualization is characterized by accuracy, clarity, and detailed representation. It is used in various applications, from visualizing molecular structures in biochemistry to modeling weather patterns in meteorology. In medicine, it aids in understanding complex anatomical structures and diseases. In engineering, it helps in designing and simulating mechanical systems. By turning complex data into visual formats, it enhances comprehension and facilitates better decision-making in scientific research and practical applications.
Characteristics and Applications of Scientific Visualization
Significant contributions to the field of Scientific Visualization include the pioneering work of Edward Tufte, known for his principles of data visualization and 'The Visual Display of Quantitative Information.' Noteworthy projects include the Human Genome Project, where data visualization played a key role in mapping genes, and the NASA Earth Observing System, which uses visualization to monitor and study global environmental changes. These works have set high standards and inspired further advancements in the visualization of scientific data.
Notable Works and Contributors in Scientific Visualization
The future of Scientific Visualization lies in the integration of artificial intelligence and machine learning to automate and enhance data interpretation. Interactive and immersive technologies such as virtual reality (VR) and augmented reality (AR) are expected to revolutionize the way scientific data is visualized and experienced. These advancements will provide more intuitive and interactive ways to explore and understand complex datasets, opening new possibilities in scientific research, education, and communication.
Future Development Trends in Scientific Visualization