9 Free Candlestick Chart Midjourney AI images
Welcome to our Candlestick Chart image collection, featuring 9 free AI-generated images. Explore a wide range of stock photos, 3D objects, vectors, and illustrations showcasing candlestick charts. All images are available for high-resolution download, and you can use the 'open in editor' feature to adjust the prompt and regenerate your perfect image.


Related Tags
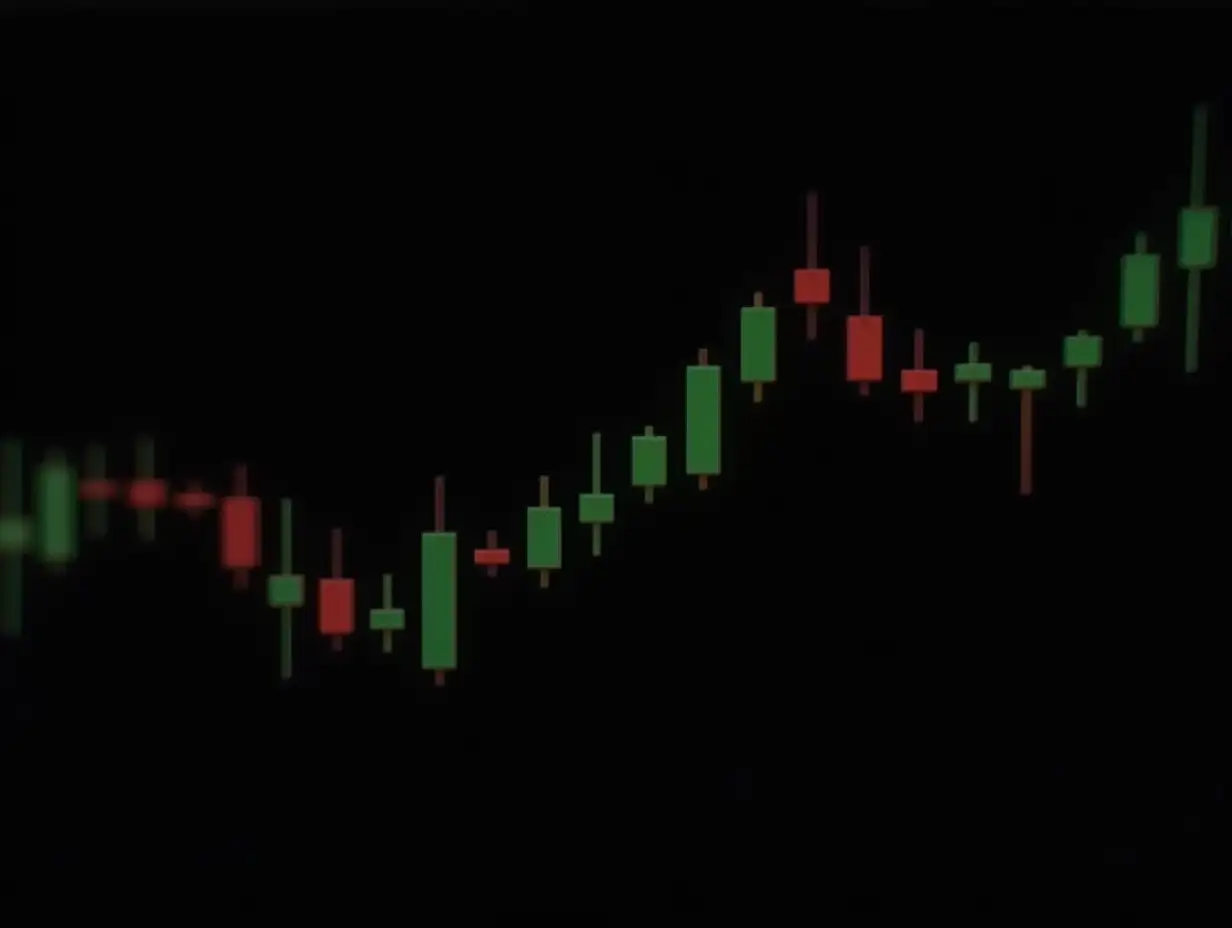
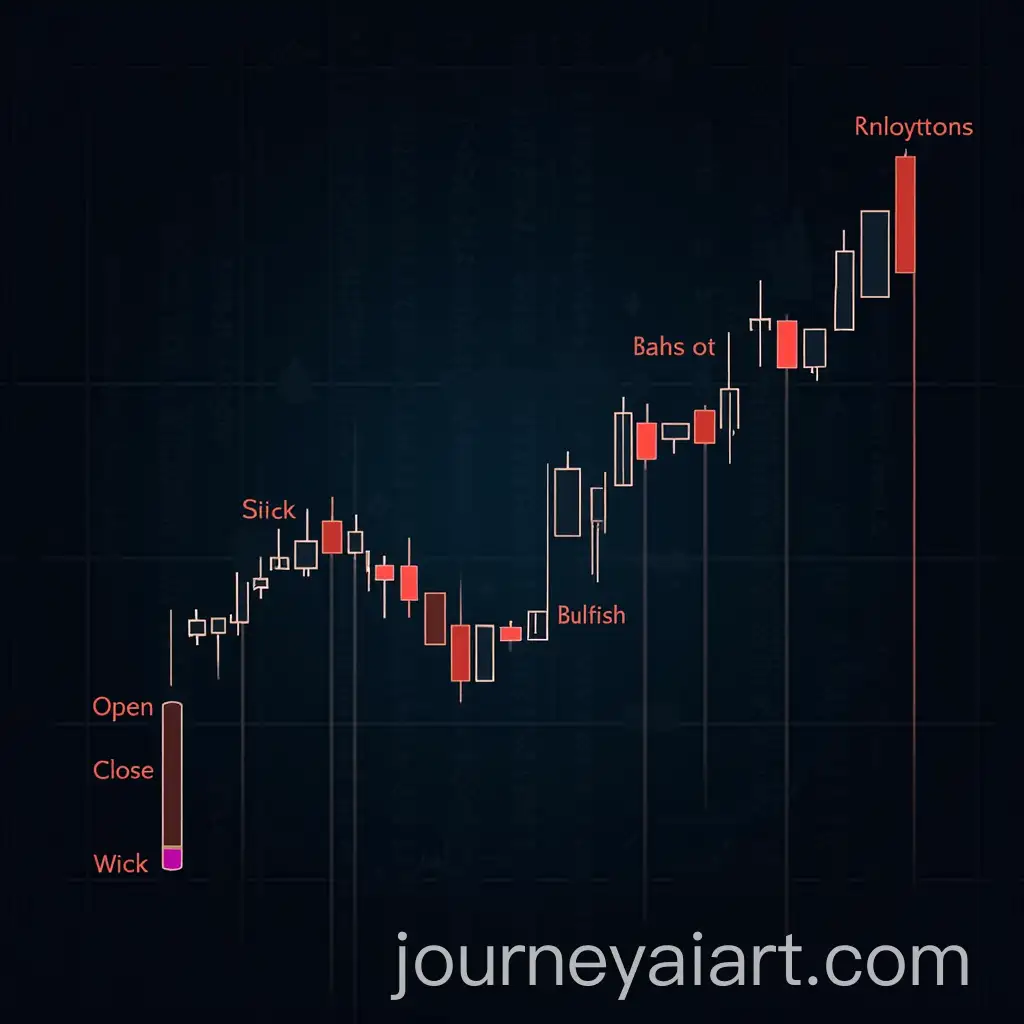
A candlestick chart is a financial tool used to represent price movements over time for stocks, commodities, or other assets. Each 'candlestick' represents four key data points: the opening price, closing price, and the highest and lowest prices within a specific time frame. It’s commonly used in stock market analysis to track trends, reversals, and overall market sentiment. AI-generated candlestick chart images visually represent these concepts, making them ideal for educational content or presentations on financial markets.
What is a Candlestick Chart? Understanding its Core Concept
Candlestick charts are widely used by traders and analysts to make informed decisions based on market trends. They help identify patterns such as bullish or bearish trends, doji patterns, and engulfing patterns, all of which provide insights into future price movements. The AI-generated candlestick chart images available on this page can be utilized by financial professionals to illustrate complex trading strategies or analysis in reports, presentations, or educational materials.
Applications of Candlestick Charts in Financial Analysis
There are various types of candlestick patterns that traders look for to predict market trends. Some popular patterns include the 'Hammer,' which suggests a potential bullish reversal, and the 'Shooting Star,' which indicates a bearish trend. Our AI-generated image collection includes various illustrations of these patterns, allowing users to access high-quality visuals for better understanding and communication of financial market insights.
Types of Candlestick Chart Patterns and Their Significance
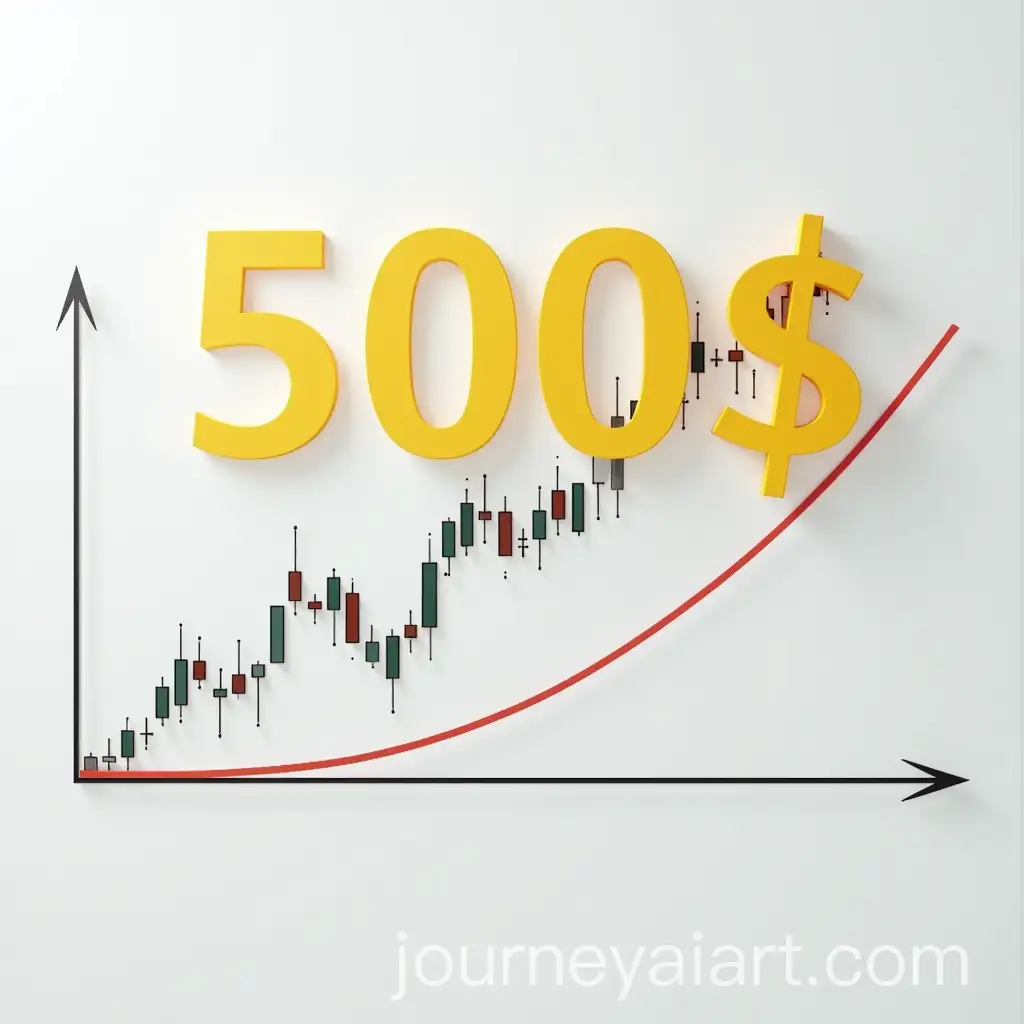
Creating custom candlestick chart images using AI is simple with our 'open in editor' feature. By adjusting the prompts, users can customize the appearance of candlestick charts to fit their specific needs, whether for educational purposes, presentations, or reports. The AI engine allows flexibility in design, including color schemes, chart dimensions, and data inputs, offering a tailored visual experience.
How to Create Custom Candlestick Chart Images Using AI